
Point Judith Oyster Gut 16S V6 Analysis
Point Judith Oyster Gut 16S V6 QIIME2 Analysis
Insert project information.
We also have V4V5 sequencing but those data are not great quality and we want to move forward with the V6 region sequencing to avoid amplifying the host. Notebook post on the analysis of V4V5 through QIIME2.
Primer information (from primers_v6.txt):
Huber et al. 2007

967F: TCGTCGGCAGCGTCAGATGTGTATAAGAGACAGCTAACCGANGAACCTYACC
        TCGTCGGCAGCGTCAGATGTGTATAAGAGACAGCNACGCGAAGAACCTTANC
        TCGTCGGCAGCGTCAGATGTGTATAAGAGACAGCAACGCGMARAACCTTACC
        TCGTCGGCAGCGTCAGATGTGTATAAGAGACAGATACGCGARGAACCTTACC
1046R: GTCTCGTGGGCTCGGAGATGTGTATAAGAGACAGCGACRRCCATGCANCACCT
This is 2x75 bp sequencing.
Beginners to 16S: see my 16S Central Working Document for other QIIME2 pipelines with more detailed descriptions on each command (Holobiont Integration QIIME2 pipeline will be most helpful for beginners).
Sequenced at URI’s GSC. Information found here.
Project Path: /data/putnamlab/shared/PointJudithData_Rebecca/amplicons16s
Path in my directory: /data/putnamlab/estrand/PointJudithData_16S/QIIME2_v6
Contents:
- Setting Up Andromeda
- FastQC
- QIIME2 Metadata
- QIIME2 Sample data import
- QIIME2 Denoising with DADA2
- QIIME2 Taxonomy classification
- QIIME2 Subsample and diversity indices
- Statistics in R
- Troubleshooting
Setting Up Andromeda
Creating directories for this project.
$ cd /data/putnamlab/estrand/PointJudithData_16S
$ mkdir QIIME2_v6
$ cd QIIME2_v6
$ mkdir scripts
$ mkdir metadata
$ mkdir fastqc_results
$ mkdir denoise_trials
$ mkdir 00_RAW_gz
Create symbolic links from raw files to this directory.
ln -s /data/putnamlab/shared/PointJudithData_Rebecca/amplicons16s/allsamples_V6/*.txt /data/putnamlab/estrand/PointJudithData_16S/QIIME2_v6/metadata

ln -s /data/putnamlab/shared/PointJudithData_Rebecca/amplicons16s/allsamples_V6/*.csv /data/putnamlab/estrand/PointJudithData_16S/QIIME2_v6/metadata

ln -s /data/putnamlab/shared/PointJudithData_Rebecca/amplicons16s/allsamples_V6/00_RAW_gz/*.fastq.gz /data/putnamlab/estrand/PointJudithData_16S/QIIME2_v6/00_RAW_gz
FASTQC: Quality control of raw read files
Fastqc resources:
- https://github.com/s-andrews/FastQC
- https://raw.githubusercontent.com/s-andrews/FastQC/master/README.txt
- How to interpret fastqc results link
Create the report from all of the fastqc files using MultiQC.
fastqc.sh
# Create script
$ cd scripts
$ nano fastqc.sh
Write script (fastqc.sh) to run fastqc and multiqc on the .qz files.
#!/bin/bash
#SBATCH -t 24:00:00
#SBATCH --nodes=1 --ntasks-per-node=1
#SBATCH --export=NONE
#SBATCH --mem=100GB
#SBATCH --mail-type=BEGIN,END,FAIL #email you when job starts, stops and/or fails
#SBATCH --mail-user=emma_strand@uri.edu #your email to send notifications
#SBATCH --account=putnamlab
#SBATCH -D /data/putnamlab/estrand/PointJudithData_16S/QIIME2_v6
#SBATCH --error="script_error_fastqc" #if your job fails, the error report will be put in this file
#SBATCH --output="output_script_fastqc" #once your job is completed, any final job report comments will be put in this file

source /usr/share/Modules/init/sh # load the module function

cd /data/putnamlab/estrand/PointJudithData_16S/QIIME2_v6

module load FastQC/0.11.9-Java-11
module load MultiQC/1.9-intel-2020a-Python-3.8.2

for file in /data/putnamlab/estrand/PointJudithData_16S/QIIME2_v6/00_RAW_gz/*fastq.gz
do
fastqc $file --outdir /data/putnamlab/estrand/PointJudithData_16S/QIIME2_v6/fastqc_results
done

multiqc --interactive fastqc_results
Output from output_script_fastqc:
Output from script_error_fastqc:
multiqc results
copy this report outside of andromeda.
scp emma_strand@bluewaves.uri.edu:/data/putnamlab/estrand/PointJudithData_16S/QIIME2_v6/multiqc_report.html /Users/emmastrand/MyProjects/Cvir_Nut_Int/output/16S_allv6/QIIME2
Red = R1 (forward); Blue = R2 (reverse)
Sequence Counts

Sequence Quality Histogram

Per Sequence Quality Score


Per Sequence GC Content

GC content is usually calculated as a percentage value and sometimes called G+C ratio or GC-ratio. GC-content percentage is calculated as Count(G + C)/Count(A + T + G + C) * 100%. Visualizing GC content across the whole length of each sequence in a file. Distribution should be normal unless over-represented sequences (sharp peaks on a normal distribution) or contamination with another organism (broad peak).
Per Base N Content

Sequence Length Distribution

Sequence Duplication Levels

Overrepresented Sequences

Can help identify contamination and if %GC above is off, could help identify the source.
Adapter Content:No samples found with any adapter contamination > 0.1%
QIIME2
Program webpage here, beginners guide here.
Read the above links thoroughly before continuing on.
General steps:
- Import metadata files (2). See above links on how to create metadata files and 16S central document link at the top of this document for example pipelines.
- Import sample data
- Quality control with DADA2
- Clustering methods
- Taxonomy classification based on imported database
Import metadata files
- Sample Manifest file
/data/putnamlab/estrand/PointJudithData_16S/QIIME2_v6/metadata/sample-manifest_PJ_V6.csv looks like:
sample-id,absolute-filepath,direction
RS126_S16,$PWD/00_RAW_gz/RS126_S16_L001_R1_001.fastq.gz,forward
RS126_S16,$PWD/00_RAW_gz/RS126_S16_L001_R2_001.fastq.gz,reverse
RS127_S28,$PWD/00_RAW_gz/RS127_S28_L001_R1_001.fastq.gz,forward
RS127_S28,$PWD/00_RAW_gz/RS127_S28_L001_R2_001.fastq.gz,reverse
RS128_S40,$PWD/00_RAW_gz/RS128_S40_L001_R1_001.fastq.gz,forward
RS128_S40,$PWD/00_RAW_gz/RS128_S40_L001_R2_001.fastq.gz,reverse
RS129_S52,$PWD/00_RAW_gz/RS129_S52_L001_R1_001.fastq.gz,forward
RS129_S52,$PWD/00_RAW_gz/RS129_S52_L001_R2_001.fastq.gz,reverse
RS130_S64,$PWD/00_RAW_gz/RS130_S64_L001_R1_001.fastq.gz,forward
$PWD = Path working directory which will be PWD="/data/putnamlab/estrand/PointJudithData_16S/QIIME2_v6 for us.
- Sample metadata file
/data/putnamlab/estrand/PointJudithData_16S/QIIME2_v6/metadata/PJ_V6Samples_Metadata.txt looks like:
#SampleID	SampleName	SampleType	Station	Location	Treatment	TypeGroup	Group	Bucket	OysterNumber	Growth	Biomass	Mortality	Denitrification_18C	Denitrification_24C	NitrousOxide_18C	NitrousOxide_24C	August_NH4_low	August_NH4_high	August_NO3_low	August_NO3_high	August_NO2_low	August_NO2_high
#q2:types	categorical	categorical	categorical	categorical	categorical	categorical	categorical	categorical	categorical	numeric	numeric	numeric	numeric	numeric	numeric	numeric	numeric	numeric	numeric	numeric	numeric	numeric
RS126_S16	BHC.1.1g	gut	BHC	Southern 	Control	gut_Southern_Control	Southern_Control	1	1	7.35	9.657	0.067	4.74	0.000.08	0.08	17.47	15.47	0.44	0.37	0.04	0.11
RS127_S28	BHC.1.2g	gut	BHC	Southern 	Control	gut_Southern_Control	Southern_Control	1	2	7.35	9.657	0.067	4.74	0.000.08	0.08	17.47	15.47	0.44	0.37	0.04	0.11
RS128_S40	BHC.1.3g	gut	BHC	Southern 	Control	gut_Southern_Control	Southern_Control	1	3	7.35	9.657	0.067	4.74	0.000.08	0.08	17.47	15.47	0.44	0.37	0.04	0.11
RS129_S52	BHC.2.1g	gut	BHC	Southern 	Control	gut_Southern_Control	Southern_Control	2	1	8.55	10.458	0.130	69.60	49.10.04	0.22	32.27	19.07	0.34	0.46	0.20	0.10
RS130_S64	BHC.2.2g	gut	BHC	Southern 	Control	gut_Southern_Control	Southern_Control	2	2	8.55	10.458	0.130	69.60	49.10.04	0.22	32.27	19.07	0.34	0.46	0.20	0.10
RS131_S76	BHC.2.4g	gut	BHC	Southern 	Control	gut_Southern_Control	Southern_Control	2	4	8.55	10.458	0.130	69.60	49.10.04	0.22	32.27	19.07	0.34	0.46	0.20	0.10
RS132_S88	BHC.3.1g	gut	BHC	Southern 	Control	gut_Southern_Control	Southern_Control	3	1	8.58	10.980	0.067	10.67	128.40	0.00	0.00	26.13	24.40	0.16	0.14	0.06	0.06
RS133_S5	BHC.3.2g	gut	BHC	Southern 	Control	gut_Southern_Control	Southern_Control	3	2	8.58	10.980	0.067	10.67	128.40	0.00	0.00	26.13	24.40	0.16	0.14	0.06	0.06
Sample data import
QIIME2 importing data tutorial.
Input format: PairedEndFastqManifestPhred33:
- “In this variant of the fastq manifest format, there must be forward and reverse read fastq.gz / fastq files for each sample ID. This format assumes that the PHRED offset used for the positional quality scores in all of the fastq.gz / fastq files is 33.”
- 33 is used in illumina1.8 or later software; 64 is used in Illumina 1.3-1.7 software (info link).
Create a script to import these data files into QIIME2.
import.sh
#!/bin/bash
#SBATCH -t 24:00:00
#SBATCH --nodes=1 --ntasks-per-node=1
#SBATCH --export=NONE
#SBATCH --mem=100GB
#SBATCH --mail-type=BEGIN,END,FAIL #email you when job starts, stops and/or fails
#SBATCH --mail-user=emma_strand@uri.edu #your email to send notifications
#SBATCH --account=putnamlab
#SBTACH -q putnamlab
#SBATCH -D /data/putnamlab/estrand/PointJudithData_16S/QIIME2_v6
#SBATCH --error="script_error_import" #if your job fails, the error report will be put in this file
#SBATCH --output="output_script_import" #once your job is completed, any final job report comments will be put in this file

source /usr/share/Modules/init/sh # load the module function
module load QIIME2/2021.4

#### METADATA FILES ####
# Path working directory to the raw files (referenced in the metadata)
# metadata says: $PWD/00_RAW_gz/RS1_S1_L001_R1_001.fastq.gz so this needs to lead the command to this path
PWD="/data/putnamlab/estrand/PointJudithData_16S/QIIME2_v6"

# Metadata path
METADATA="metadata/PJ_V6Samples_Metadata.txt"

# Sample manifest path
MANIFEST="metadata/sample-manifest_PJ_V6.csv"

#########################

qiime tools import \
  --type 'SampleData[PairedEndSequencesWithQuality]' \
  --input-path $MANIFEST \
  --input-format PairedEndFastqManifestPhred33 \
  --output-path PJ-paired-end-sequences.qza
Output from output_script_import:
Imported metadata/sample-manifest_PJ_V6.csv as PairedEndFastqManifestPhred33 to PJ-paired-end-sequences.qza
PJ-paired-end-sequences.qza is the output file that we will input in the next denoising step.
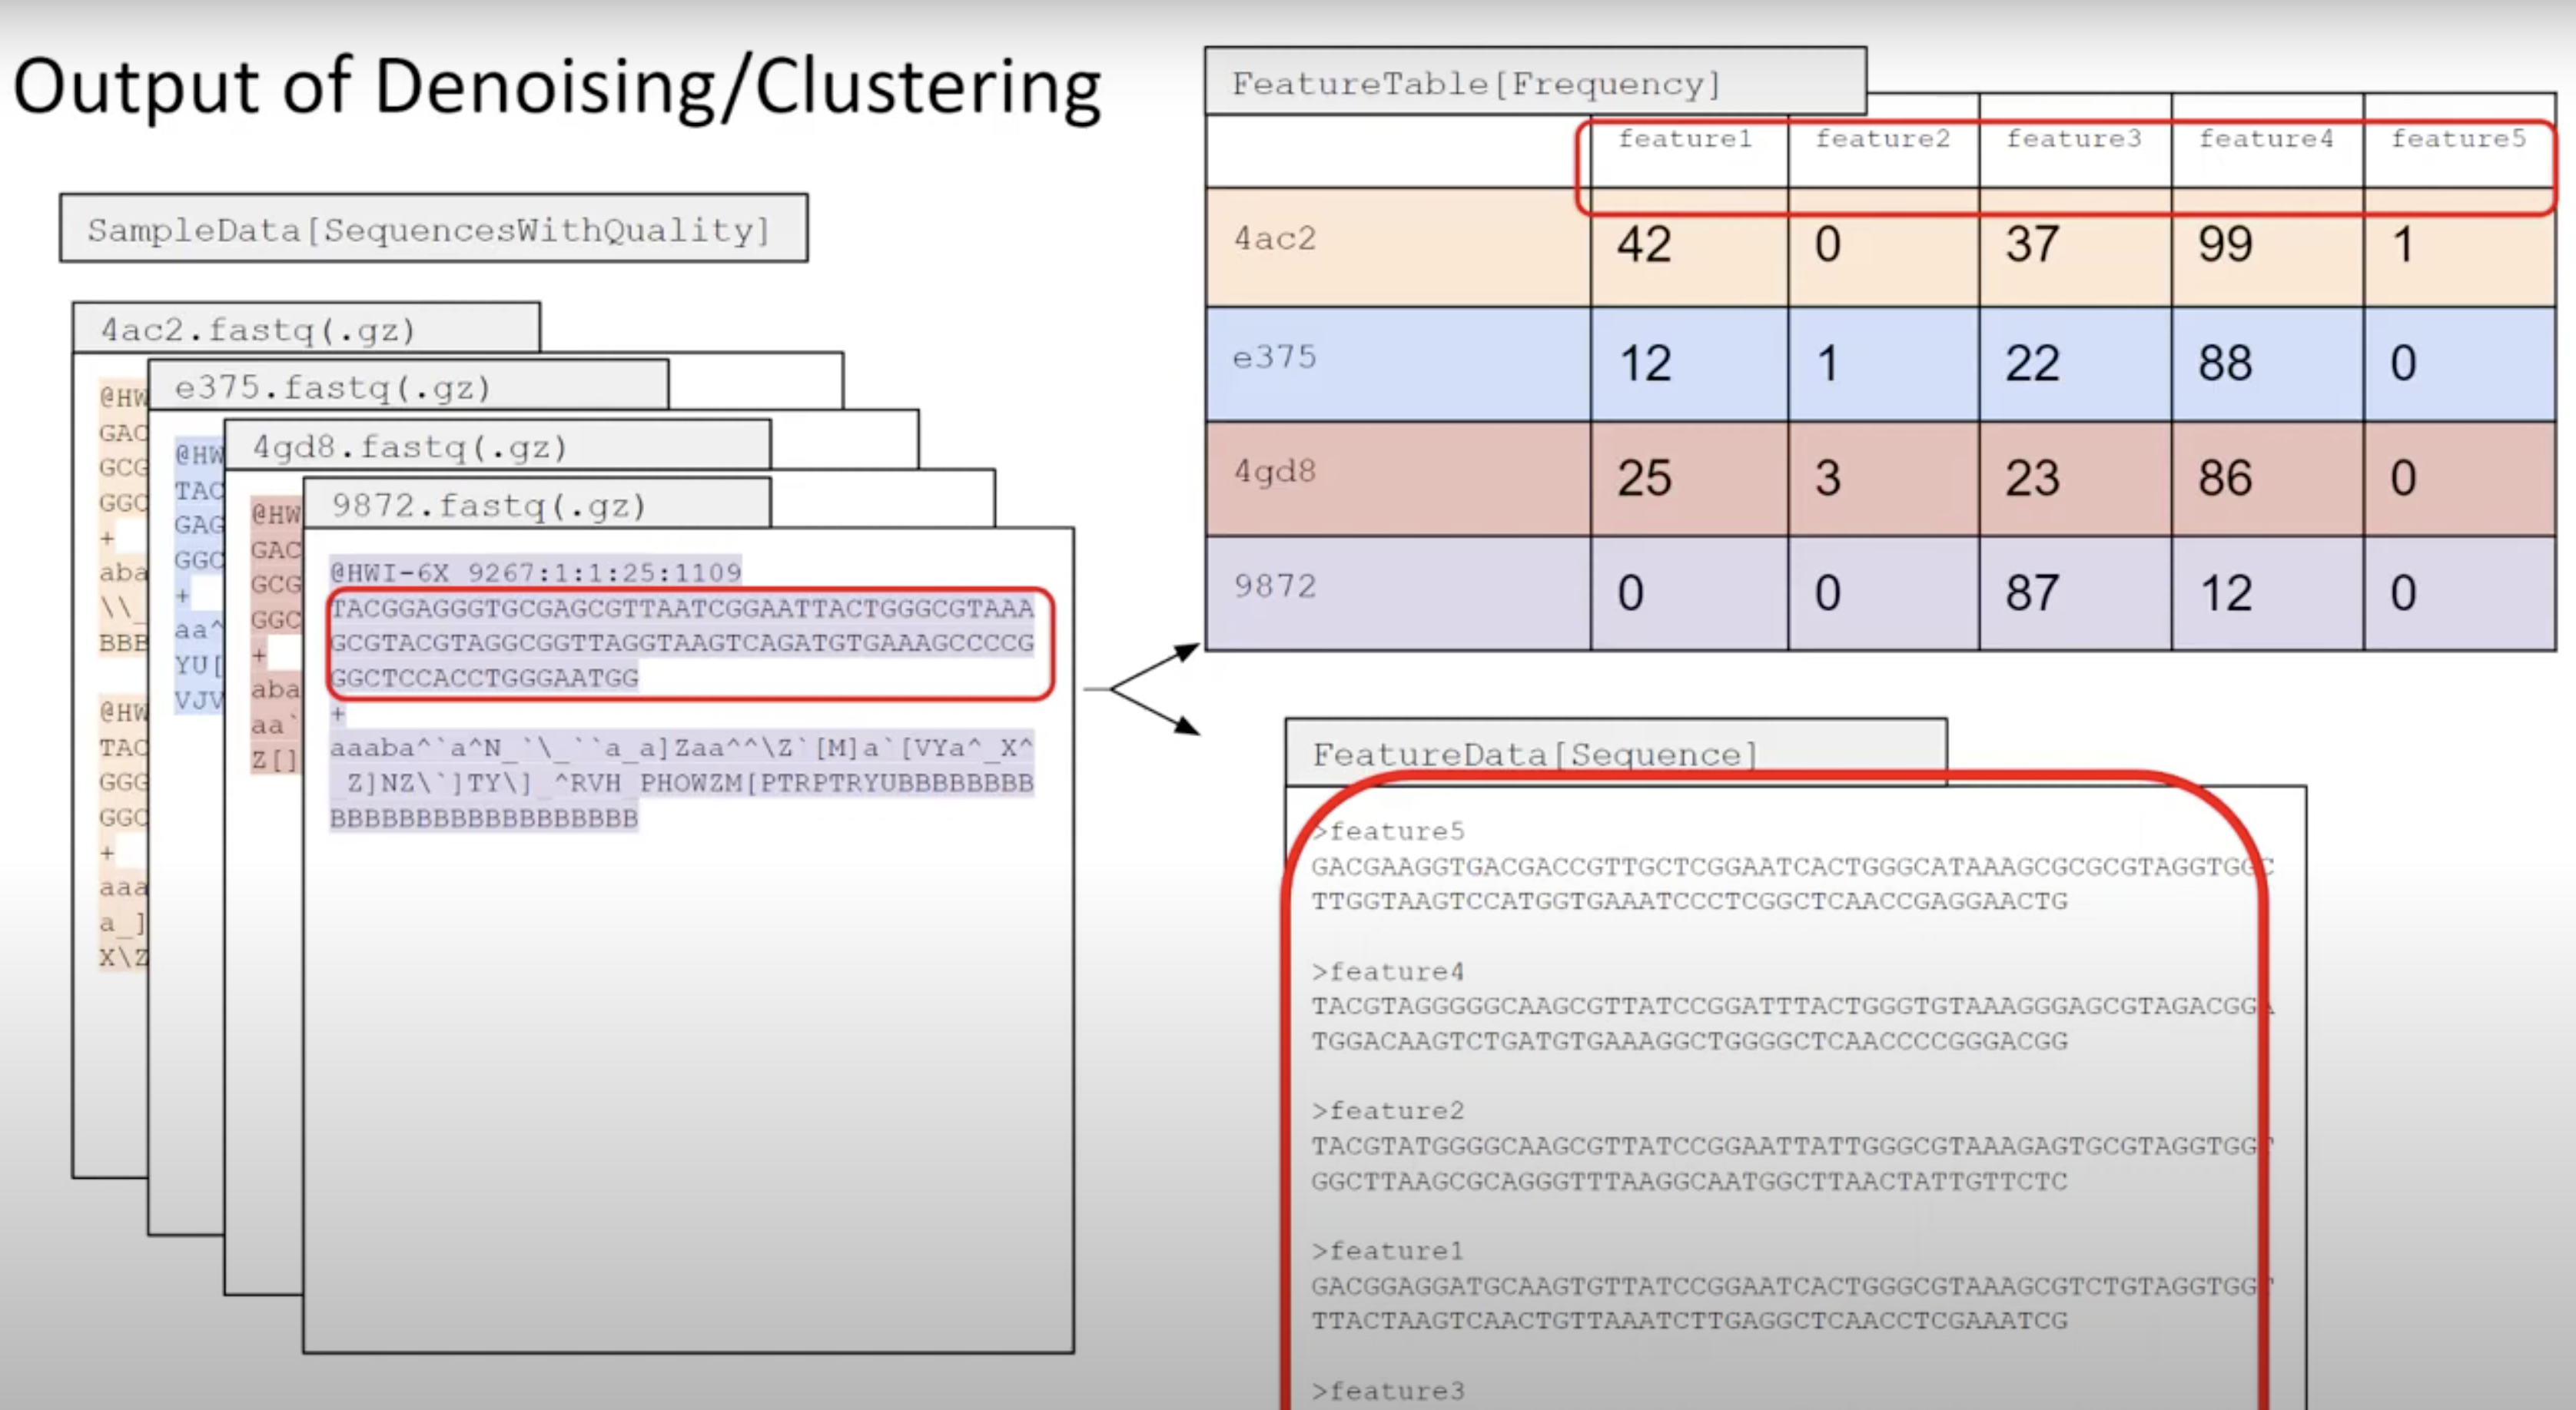
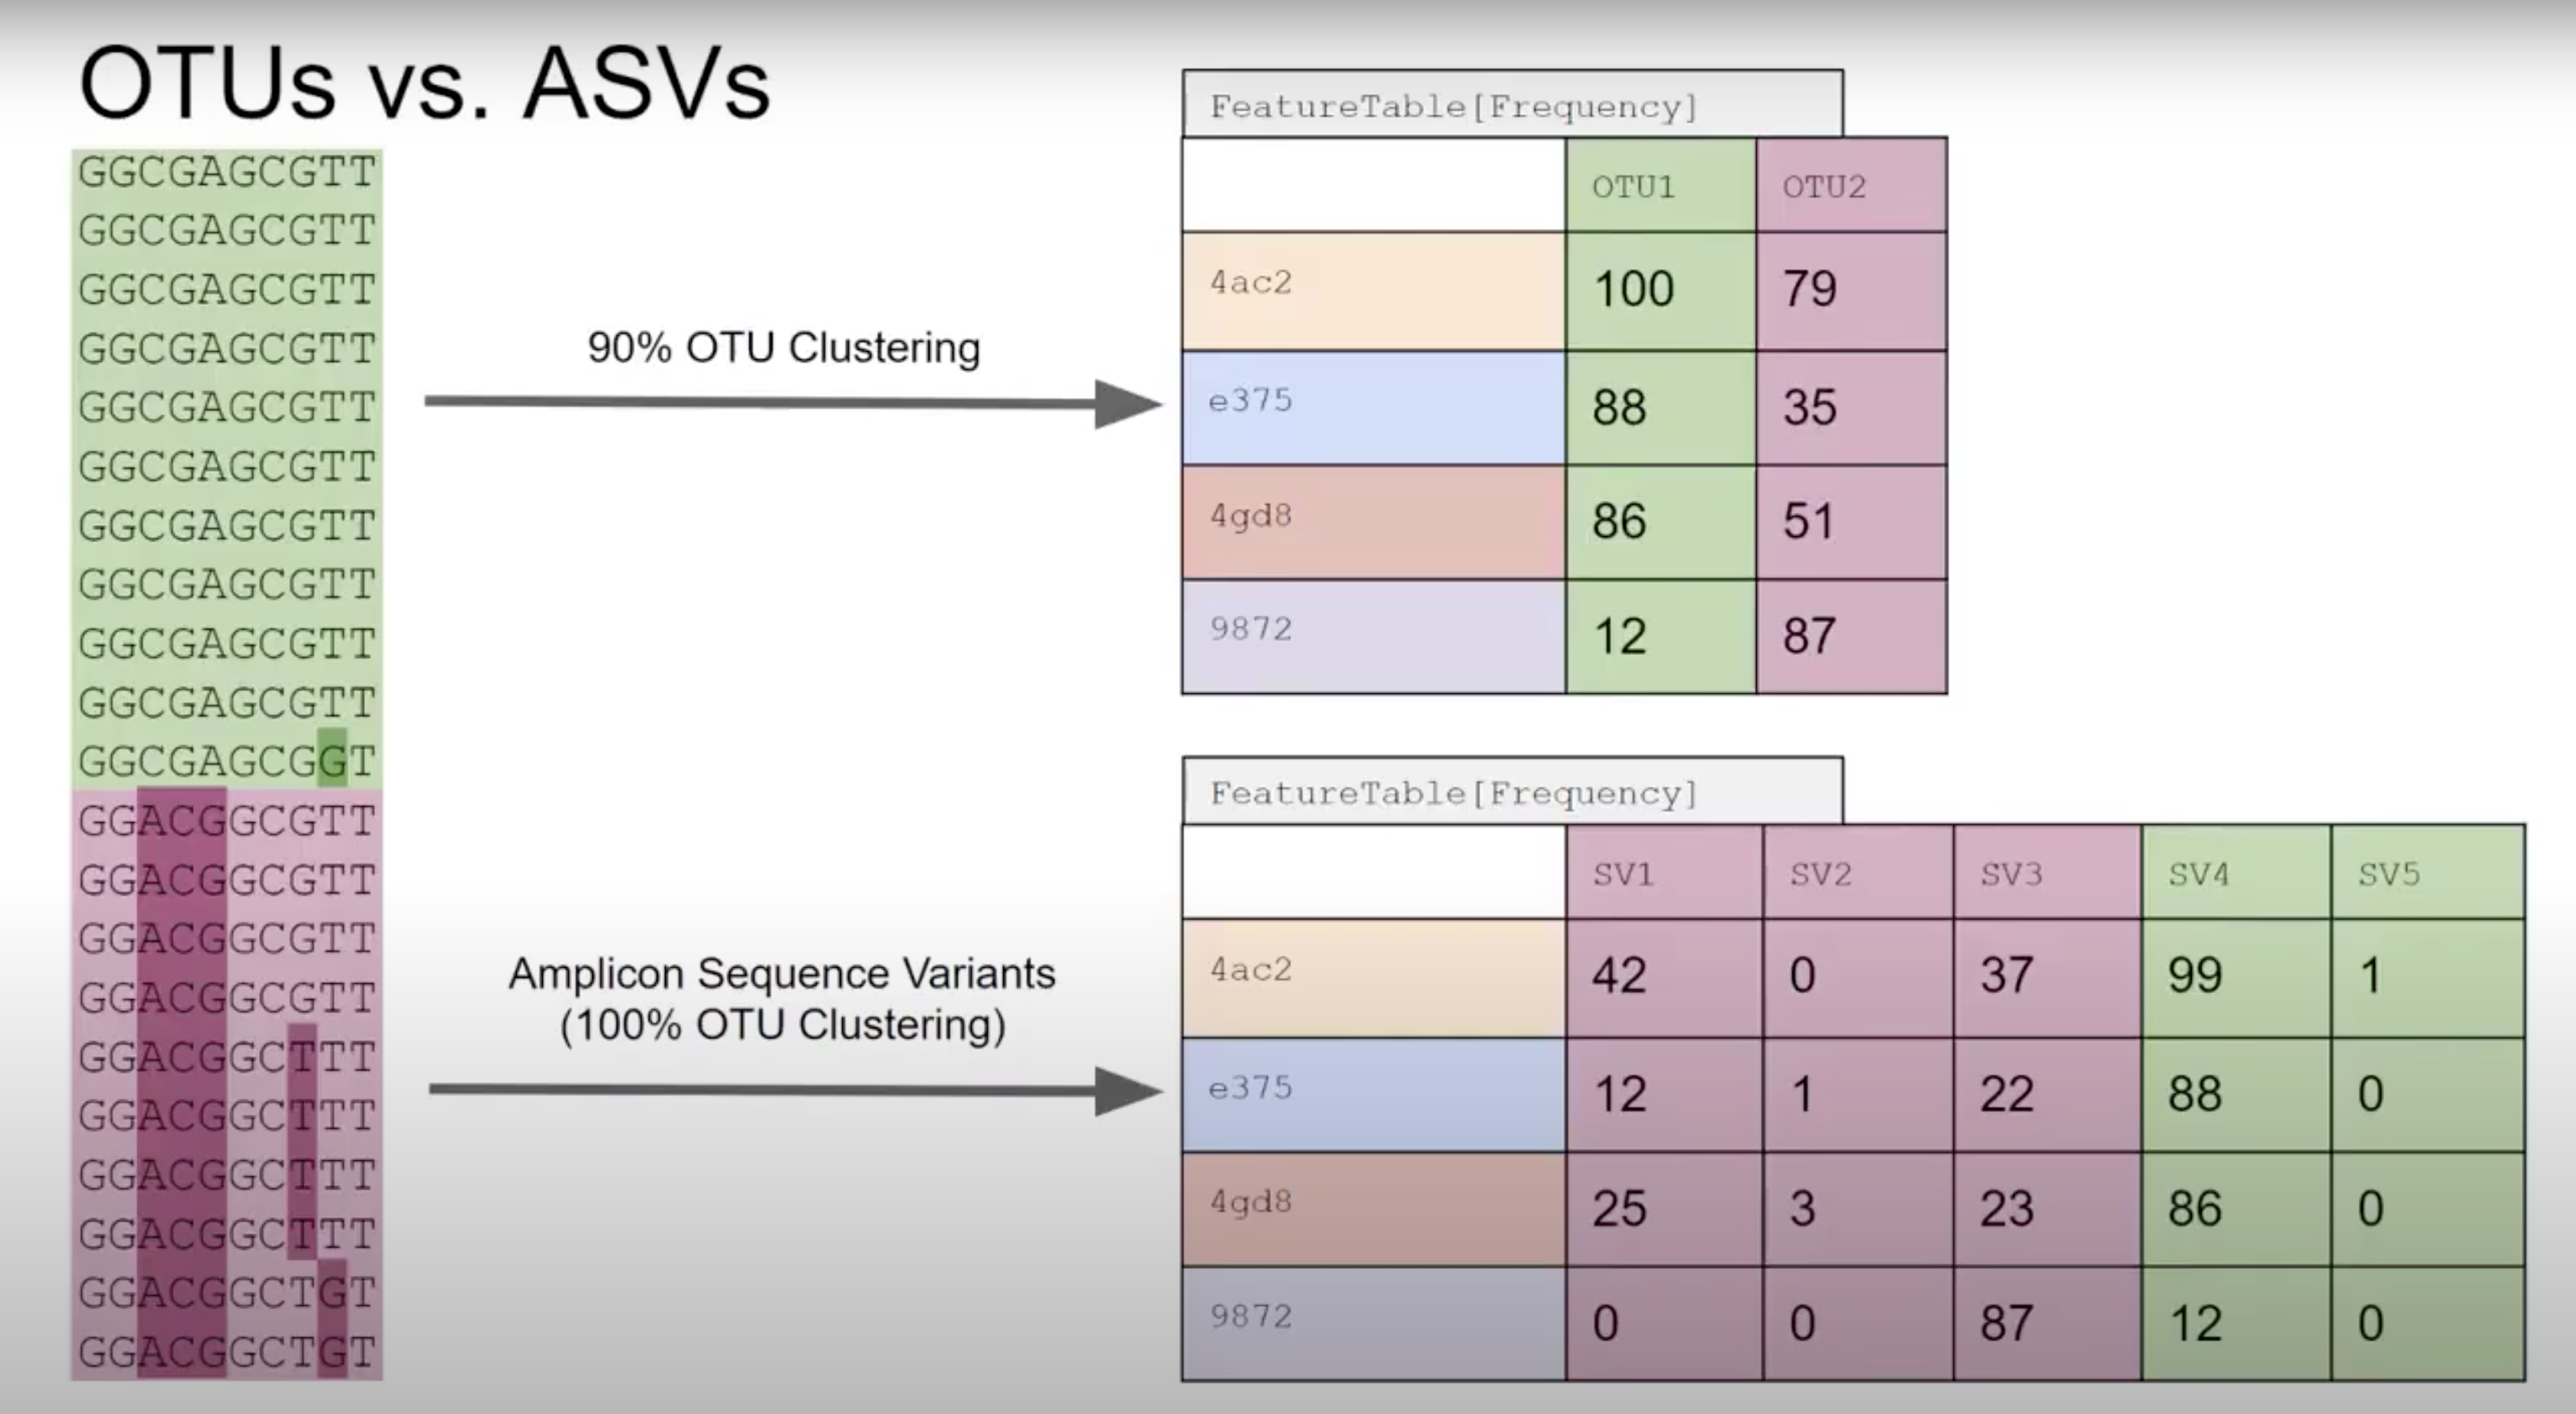
Denoising with DADA2 and Clustering
Denoising youtube video from QIIME2’s channel: https://www.youtube.com/watch?v=PmtqSa4Z1TQ.
Denoisers attempt to model error profiles based on quality scores, expected error rates, and observed frequency of each of the unique sequences found. In this process DADA2 (program we use) will group sequences into ASV’s (similar concept to 100% similarity OTU). OTU vs ASV is up for debate - either is OK but base that decision in data and the aim of your project/question.
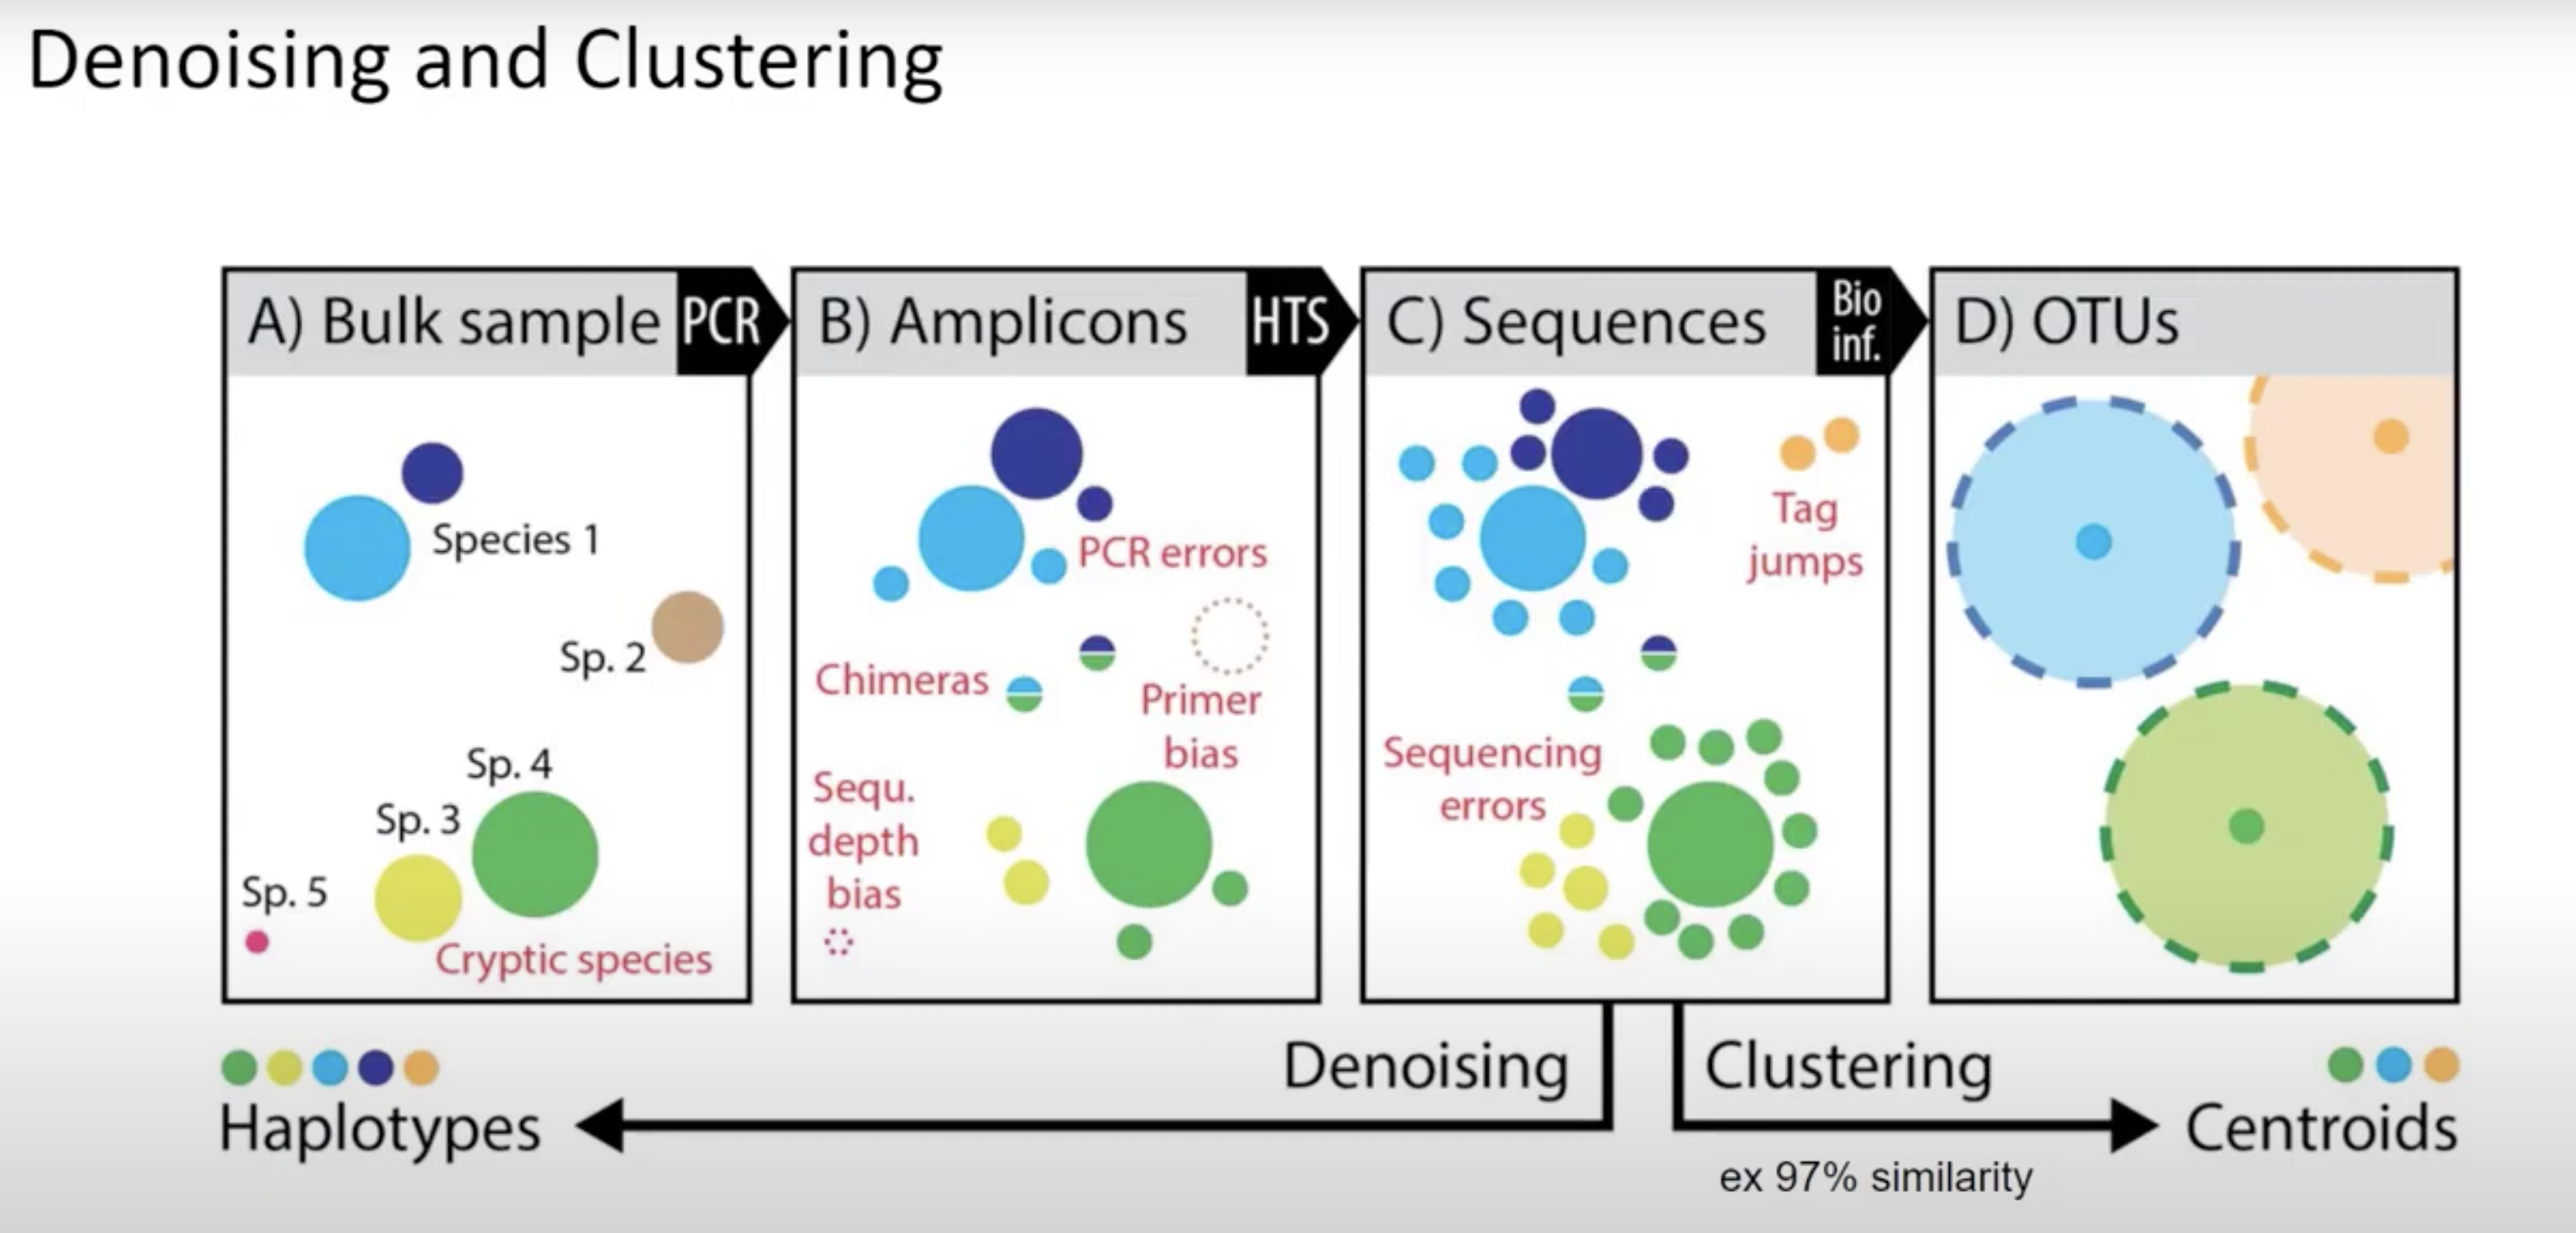
QIIME2 then names this as ‘Features’ (mostly becasue QIIME2 can be used for all sorts of -omics).
Primer length is 19 nt.
I tried the following denoise parameters:
- With 19/19 bp trimming; 70/70 truncating (
denoise-19-70.sh) - With 19/19 bp trimming; 75/75 truncating (
denoise-19-75.sh)
I previously tried 4 other parameters but figured out this was with the wrong primer length. See results for this in the troubleshooting section at the bottom of this post.
denoise paramter trials
Output from these trials in this directory: PointJudithData_16S/QIIME2_v6/denoise_trials.
All parameter trials will have:
#SBATCH -D /data/putnamlab/estrand/PointJudithData_16S/QIIME2_v6/denoise_trials#SBATCH --error="script_error_denoise"with script name#SBATCH --output="output_script_denoise"with script name- Change paths for:
../PJ-paired-end-sequences.qza,../metadata #SBATCH --job-name="#-denoise"
copy denoise output to desktop.
scp -r emma_strand@bluewaves.uri.edu:/data/putnamlab/estrand/PointJudithData_16S/QIIME2_v6/denoise_trials /Users/emmastrand/MyProjects/Cvir_Nut_Int/output/16S_allv6/QIIME2/
Put the above files into QIIME2 view and download as tsv files.
Output from R script to visualize the above denoising statistics. R script: denoise-stats.R is in our Cvir repo.
Results from the trials above:


| Metric | Frequency | ||||||||
|---|---|---|---|---|---|---|---|---|---|
| Denoise parameter | Number of samples | Number of features | Total frequency | Minimum frequency | 1st quartile | Median frequency | 3rd quartile | Maximum frequency | Mean frequency |
| With 19 bp trimming; 75/75 truncating | 112 | 16,550 | 4,152,959 | 9,932 | 31,420.50 | 37,617.00 | 43,586.75 | 60,430.00 | 37,079.99 |
| With 19 bp trimming; 70/70 truncating | 112 | 17,436 | 4,952,942 | 12,070.00 | 38,178.00 | 43,904.00 | 50,148.25 | 74,203.00 | 44,222.70 |


Based on the above, I will move forward with 19 trimming and 70 truncating.
denoise.sh
#!/bin/bash
#SBATCH --job-name="denoise"
#SBATCH -t 24:00:00
#SBATCH --nodes=1 --ntasks-per-node=1
#SBATCH --export=NONE
#SBATCH --mem=100GB
#SBATCH --mail-type=BEGIN,END,FAIL #email you when job starts, stops and/or fails
#SBATCH --mail-user=emma_strand@uri.edu #your email to send notifications
#SBATCH --account=putnamlab
#SBTACH -q putnamlab
#SBATCH -D /data/putnamlab/estrand/PointJudithData_16S/QIIME2_v6
#SBATCH --error="script_error_denoise" #if your job fails, the error report will be put in this file
#SBATCH --output="output_script_denoise" #once your job is completed, any final job report comments will be put in this file

source /usr/share/Modules/init/sh # load the module function
module load QIIME2/2021.4

#### METADATA FILES ####
# Path working directory to the raw files (referenced in the metadata)
# metadata says: $PWD/00_RAW_gz/RS1_S1_L001_R1_001.fastq.gz so this needs to lead the command to this path
PWD="/data/putnamlab/estrand/PointJudithData_16S/QIIME2_v6"

# Metadata path
METADATA="metadata/PJ_V6Samples_Metadata.txt"

# Sample manifest path
MANIFEST="metadata/sample-manifest_PJ_V6.csv"

#########################

#### DENOISING WITH DADA2

qiime dada2 denoise-paired --verbose --i-demultiplexed-seqs PJ-paired-end-sequences.qza \
  --p-trunc-len-r 70 --p-trunc-len-f 70 \
  --p-trim-left-r 19 --p-trim-left-f 19 \
  --o-table table.qza \
  --o-representative-sequences rep-seqs.qza \
  --o-denoising-stats denoising-stats.qza \
  --p-n-threads 20

#### CLUSTERING

# Summarize feature table and sequences
qiime metadata tabulate \
  --m-input-file denoising-stats.qza \
  --o-visualization denoising-stats.qzv
qiime feature-table summarize \
  --i-table table.qza \
  --o-visualization table.qzv \
  --m-sample-metadata-file $METADATA
qiime feature-table tabulate-seqs \
  --i-data rep-seqs.qza \
  --o-visualization rep-seqs.qzv
Copy output to desktop for qiime2 view
Outside of andromeda.
scp -r emma_strand@bluewaves.uri.edu:/data/putnamlab/estrand/PointJudithData_16S/QIIME2_v6/table.qzv /Users/emmastrand/MyProjects/Cvir_Nut_Int/output/16S_allv6/QIIME2

rep-seqs.qzv
denoising-stats.qzv
table.qzv
Taxonomy classification based on imported database
Description from QIIME2 documentation:
- We can do this by comparing our query sequences (i.e., our features, be they ASVs or OTUs) to a reference database of sequences with known taxonomic composition.
- Simply finding the closest alignment is not really good enough — because other sequences that are equally close matches or nearly as close may have different taxonomic annotations.
- So we use taxonomy classifiers to determine the closest taxonomic affiliation with some degree of confidence or consensus (which may not be a species name if one cannot be predicted with certainty!), based on alignment, k-mer frequencies, etc. More info on this here.
Workflow from QIIME2 documentation:

Reference database = FeatureData[Taxonomy] and FeatureData[Sequence].
Pre-trained classifier choice information here.
“Training a classifier”: created via machine learning algorithm (called Naive Bayes) and showing a classifier examples where we know the answer (our reference database). In Mothur, this process uses the program vsearch and BLAST instead of a machine learning classifier. If we are not happy with our classifier we can use classify-consesus-blast or classify-consesus-vsearch within QIIME2.
There are 3 ways we are testing classifiers:
silva-138-99-nb-classifier: From the Silva database 99% OTUs from full length sequences.silva-138-99-nb-weighted-classifier: Trained with weights that take into account the fact that not all species are equally likely to be observed. This may give us higher classification precision. This might not work as well for us because coral reefs and marine habitats are not the habitats used their analysis RE weighted classifiers.- Training our own classifier with the silva ref seqs, ref taxonomy, and our rep-seqs file from the denoise.sh step. This is specific to V6 region instead of using the whole silva database.
Pre-trained classifiers are provided in the QIIME 2 data resources.
1. Silva database 99% OTUs from full length sequences - unweighted
Download the classifier.
wget https://data.qiime2.org/2022.2/common/silva-138-99-nb-classifier.qza
taxonomy-unweighted.sh:
qiime feature-classifier classify-sklearn \
  --i-classifier ../metadata/silva-138-99-nb-classifier.qza \
  --i-reads ../rep-seqs.qza \
  --o-classification taxonomy-unweighted.qza
“-unweighted” prefix on all output files.
2. Silva database 99% OTUs from full length sequences - weighted
wget https://data.qiime2.org/2022.2/common/silva-138-99-nb-weighted-classifier.qza
taxonomy-weighted.sh:
qiime feature-classifier classify-sklearn \
  --i-classifier ../metadata/silva-138-99-nb-weighted-classifier.qza \
  --i-reads ../rep-seqs.qza \
  --o-classification taxonomy-weighted.qza
“-weighted” prefix on all output files.
3. Training our own classifier
https://docs.qiime2.org/2022.2/tutorials/feature-classifier/. Two elements are required for training the classifier: the reference sequences and the corresponding taxonomic classifications.
Obtaining and importing reference data sets.
$ cd /data/putnamlab/estrand/PointJudithData_16S/QIIME2_v6/metadata
$ wget https://data.qiime2.org/2022.2/common/silva-138-99-seqs.qza
$ wget https://data.qiime2.org/2022.2/common/silva-138-99-tax.qza
Required data files:
rep-seqs.qzafrom the denoise.sh scriptsilva-138-99-seqs.qza= reference sequencessilva-138-99-tax.qza= reference taxonomy
Extract reference reads.
Primers:
FORWARD
CTAACCGANGAACCTYACC
CNACGCGAAGAACCTTANC
CAACGCGMARAACCTTACC
ATACGCGARGAACCTTACC

REVERSE
CGACRRCCATGCANCACCT
Input for the primers:
- R: CGACRRCCATGCANCACCT
- F: MNAMSCGMNRAACCTYANC
Forward primer sequence includes all 4 primers (i.e. M in first position will code for either C or A)
train-extract.sh:
This took 4 days and 19 hours.
#!/bin/bash
#SBATCH --job-name="train"
#SBATCH -t 24:00:00
#SBATCH --nodes=1 --ntasks-per-node=1
#SBATCH --export=NONE
#SBATCH --mem=100GB
#SBATCH --mail-type=BEGIN,END,FAIL #email you when job starts, stops and/or fails
#SBATCH --mail-user=emma_strand@uri.edu #your email to send notifications
#SBATCH --account=putnamlab
#SBTACH -q putnamlab
#SBATCH -D /data/putnamlab/estrand/PointJudithData_16S/QIIME2_v6
#SBATCH --error="script_error_train-classifier" #if your job fails, the error report will be put in this file
#SBATCH --output="output_script_train-classifier" #once your job is completed, any final job report comments will be put in this file

source /usr/share/Modules/init/sh # load the module function
module load QIIME2/2021.4

qiime feature-classifier extract-reads \
  --i-sequences metadata/silva-138-99-seqs.qza \
  --p-f-primer MNAMSCGMNRAACCTYANC \
  --p-r-primer CGACRRCCATGCANCACCT \
  --p-trunc-len 100 \
  --o-reads metadata/ref-seqs.qza
Output artifact: ref-seqs.qza.
Train the classifier
train-classifier.sh:
This took 30 minutes.
#!/bin/bash
#SBATCH --job-name="train"
#SBATCH -t 24:00:00
#SBATCH --nodes=1 --ntasks-per-node=1
#SBATCH --export=NONE
#SBATCH --mem=100GB
#SBATCH --mail-type=BEGIN,END,FAIL #email you when job starts, stops and/or fails
#SBATCH --mail-user=emma_strand@uri.edu #your email to send notifications
#SBATCH --account=putnamlab
#SBTACH -q putnamlab
#SBATCH -D /data/putnamlab/estrand/PointJudithData_16S/QIIME2_v6
#SBATCH --error="script_error_train-classifier" #if your job fails, the error report will be put in this file
#SBATCH --output="output_script_train-classifier" #once your job is completed, any final job report comments will be put in this file

source /usr/share/Modules/init/sh # load the module function
module load QIIME2/2021.4

qiime feature-classifier fit-classifier-naive-bayes \
  --i-reference-reads metadata/ref-seqs.qza \
  --i-reference-taxonomy metadata/silva-138-99-tax.qza \
  --o-classifier metadata/classifier.qza
Output artifact: classifier.qza.
script to run own classifier
taxonomy-trained.sh:
qiime feature-classifier classify-sklearn \
  --i-classifier ../metadata/classifier.qza \
  --i-reads ../rep-seqs.qza \
  --o-classification taxonomy-trained.qza
“-trained” prefix on all output files.
taxonomy-trained.sh
#!/bin/bash
#SBATCH --job-name="trained"
#SBATCH -t 24:00:00
#SBATCH --nodes=1 --ntasks-per-node=1
#SBATCH --export=NONE
#SBATCH --mem=100GB
#SBATCH --mail-type=BEGIN,END,FAIL #email you when job starts, stops and/or fails
#SBATCH --mail-user=emma_strand@uri.edu #your email to send notifications
#SBATCH --account=putnamlab
#SBTACH -q putnamlab
#SBATCH -D /data/putnamlab/estrand/PointJudithData_16S/QIIME2_v6/classifier_trials
#SBATCH --error="script_error_taxonomy-trained" #if your job fails, the error report will be put in this file
#SBATCH --output="output_script_taxonomy-trained" #once your job is completed, any final job report comments will be put in this file

source /usr/share/Modules/init/sh # load the module function
module load QIIME2/2021.4

# Metadata path
METADATA="../metadata/PJ_V6Samples_Metadata.txt"

#### TAXONOMY CLASSIFICATION

qiime feature-classifier classify-sklearn \
  --i-classifier ../metadata/classifier.qza \
  --i-reads ../rep-seqs.qza \
  --o-classification taxonomy-trained.qza

qiime taxa filter-table \
     --i-table ../table.qza \
     --i-taxonomy taxonomy-trained.qza \
     --p-mode contains \
     --p-exclude "Unassigned","Chloroplast","Eukaryota" \
     --o-filtered-table table-trained-filtered.qza

qiime metadata tabulate \
    --m-input-file taxonomy-trained.qza \
    --o-visualization taxonomy-trained.qzv
qiime taxa barplot \
    --i-table table-trained-filtered.qza \
    --i-taxonomy taxonomy-trained.qza \
    --m-metadata-file $METADATA \
    --o-visualization taxa-bar-plots-trained-filtered.qzv
qiime metadata tabulate \
    --m-input-file ../rep-seqs.qza \
    --m-input-file taxonomy-trained.qza \
    --o-visualization tabulated-feature-metadata-trained.qzv

qiime feature-table summarize \
    --i-table table-trained-filtered.qza \
    --o-visualization table-trained-filtered.qzv \
    --m-sample-metadata-file $METADATA
Output comparison from 3 classifiers
Copy and paste from andromeda to desktop.
scp -r emma_strand@bluewaves.uri.edu:/data/putnamlab/estrand/PointJudithData_16S/QIIME2_v6/classifier_trials /Users/emmastrand/MyProjects/Cvir_Nut_Int/output/16S_allv6/QIIME2
Files to put into QIIME2 view:
taxa-bar-plots-unweighted-filtered.qzvandtable-unweighted-filtered.qzvtaxa-bar-plots-weighted-filtered.qzvandtable-weighted-filtered.qzvtaxa-bar-plots-trained-filtered.qzvandtable-trained-filtered.qzv
Classifier choice
Summary from table.qzv vs post-filtering classifier choices
Are there any other groups we should be filtering because we are working with oysters?
| Metric | Frequency | ||||||||
|---|---|---|---|---|---|---|---|---|---|
| Taxonomic output | Number of samples | Number of features | Total frequency | Minimum frequency | 1st quartile | Median frequency | 3rd quartile | Maximum frequency | Mean frequency |
| Pre-filtering (table.qzv) from 19 bp; 70/70 truncating | 112 | 17,436 | 4,952,942 | 12,070.00 | 38,178.00 | 43,904.00 | 50,148.25 | 74,203.00 | 44,222.70 |
| **Post filtering ** | |||||||||
| Silva database 99% OTUs from full length sequences - unweighted | 112 | 12,679 | 3,839,983 | 7,562.00 | 29,221.00 | 33,842.50 | 40,364.75 | 59,072.00 | 34,285.56 |
| Silva database 99% OTUs from full length sequences - weighted | 112 | 16,602 | 4,539,618 | 11,524.00 | 35,458.00 | 39,033.50 | 45,922.25 | 66,900.00 | 40,532.30 |
| Our own trained classifier | 112 | 16,848 | 4,554,455 | 11,567.00 | 35,564.50 | 39,107.50 | 46,150.50 | 67,487.00 | 40,664.78 |
Read frequnecy per sample


Taxa bar plots
Unweighted Silva Database Classifier

Weighted Silva Database Classifier

Our own classifier with silva tax and seq information

I’m moving forward with our own trained classifier because this is specific to our V6 region and decreased the amount of generic bacteria in our samples and increased read depth per sample
From the sample frequency csv and subsetting to only the gut samples, our lowest read depth is 29,006 and highest is 59,385. For the next step, we’ll subsample to 29,006.
Subsampling and diversity indices
The various diversity analyses you can do with QIIME2:

--p-sampling-depth 29006 \ based on lowest # of reads for now (see above section). This passes our 1,500-3,000 minimum.
--p-max-depth 10000 \. The range of samples is high so I’m starting with 20,000 to see where our rarefraction curve stabilizes.
To re-run this script, need to delete core-metrics-results folder or rename the original folder.
Running beta diversity on SampleType and Treatment for now. We can also do this in R from the QIIME2 outputs. See Kevin’s script for this.
this script overrides the previous beta diversity script – output 2 different ones for sample type and treatment. or just keep one.
diversity.sh with our own trained classifier
#!/bin/bash
#SBATCH -t 24:00:00
#SBATCH --nodes=1 --ntasks-per-node=1
#SBATCH --export=NONE
#SBATCH --mem=100GB
#SBATCH --mail-type=BEGIN,END,FAIL #email you when job starts, stops and/or fails
#SBATCH --mail-user=emma_strand@uri.edu #your email to send notifications
#SBATCH --account=putnamlab
#SBTACH -q putnamlab
#SBATCH -D /data/putnamlab/estrand/PointJudithData_16S/QIIME2_v6
#SBATCH --error="script_error_diversity" #if your job fails, the error report will be put in this file
#SBATCH --output="output_script_diversity" #once your job is completed, any final job report comments will be put in this file

source /usr/share/Modules/init/sh # load the module function
module load QIIME2/2021.4

# Metadata path
METADATA="metadata/PJ_V6Samples_Metadata.txt"

#### CREATES PHYLOGENETIC TREES

# align and mask sequences
qiime alignment mafft \
  --i-sequences rep-seqs.qza \
  --o-alignment aligned-rep-seqs.qza
qiime alignment mask \
  --i-alignment aligned-rep-seqs.qza \
  --o-masked-alignment masked-aligned-rep-seqs.qza

# calculate tree
qiime phylogeny fasttree \
  --i-alignment masked-aligned-rep-seqs.qza \
  --o-tree unrooted-tree.qza
qiime phylogeny midpoint-root \
  --i-tree unrooted-tree.qza \
  --o-rooted-tree rooted-tree.qza

#### CALCULATES OVERALL DIVERSITY
## change sub sampling depth values

qiime diversity core-metrics-phylogenetic \
  --i-phylogeny rooted-tree.qza \
  --i-table classifier_trials/table-trained-filtered.qza \
  --p-sampling-depth 29006 \
  --m-metadata-file $METADATA \
  --output-dir core-metrics-results

qiime diversity alpha-group-significance \
  --i-alpha-diversity core-metrics-results/faith_pd_vector.qza \
  --m-metadata-file $METADATA \
  --o-visualization core-metrics-results/faith-pd-group-significance.qzv
qiime diversity alpha-group-significance \
  --i-alpha-diversity core-metrics-results/evenness_vector.qza \
  --m-metadata-file $METADATA \
  --o-visualization core-metrics-results/evenness-group-significance.qzv

qiime diversity beta-group-significance \
  --i-distance-matrix core-metrics-results/unweighted_unifrac_distance_matrix.qza \
  --m-metadata-file $METADATA \
  --m-metadata-column SampleType \
  --o-visualization core-metrics-results/unweighted-unifrac-station-significance.qzv \
  --p-pairwise
qiime diversity beta-group-significance \
  --i-distance-matrix core-metrics-results/unweighted_unifrac_distance_matrix.qza \
  --m-metadata-file $METADATA  \
  --m-metadata-column Treatment \
  --o-visualization core-metrics-results/unweighted-unifrac-group-significance.qzv \
  --p-pairwise

# This script calculates the rarefaction curve for the data
  qiime diversity alpha-rarefaction \
    --i-table classifier_trials/table-trained-filtered.qza \
    --i-phylogeny rooted-tree.qza \
    --p-max-depth 10000 \
    --m-metadata-file $METADATA \
    --o-visualization alpha-rarefaction.qzv
From script_error_diversity:
No contents (no errors found).
From output_script_diversity:
Saved FeatureTable[Frequency] to: core-metrics-results/rarefied_table.qza
Saved SampleData[AlphaDiversity] to: core-metrics-results/faith_pd_vector.qza
Saved SampleData[AlphaDiversity] to: core-metrics-results/observed_features_vector.qza
Saved SampleData[AlphaDiversity] to: core-metrics-results/shannon_vector.qza
Saved SampleData[AlphaDiversity] to: core-metrics-results/evenness_vector.qza
Saved DistanceMatrix to: core-metrics-results/unweighted_unifrac_distance_matrix.qza
Saved DistanceMatrix to: core-metrics-results/weighted_unifrac_distance_matrix.qza
Saved DistanceMatrix to: core-metrics-results/jaccard_distance_matrix.qza
Saved DistanceMatrix to: core-metrics-results/bray_curtis_distance_matrix.qza
Saved PCoAResults to: core-metrics-results/unweighted_unifrac_pcoa_results.qza
Saved PCoAResults to: core-metrics-results/weighted_unifrac_pcoa_results.qza
Saved PCoAResults to: core-metrics-results/jaccard_pcoa_results.qza
Saved PCoAResults to: core-metrics-results/bray_curtis_pcoa_results.qza
Saved Visualization to: core-metrics-results/unweighted_unifrac_emperor.qzv
Saved Visualization to: core-metrics-results/weighted_unifrac_emperor.qzv
Saved Visualization to: core-metrics-results/jaccard_emperor.qzv
Saved Visualization to: core-metrics-results/bray_curtis_emperor.qzv
Saved Visualization to: core-metrics-results/faith-pd-group-significance.qzv
Saved Visualization to: core-metrics-results/evenness-group-significance.qzv
Saved Visualization to: core-metrics-results/unweighted-unifrac-station-significance.qzv
Saved Visualization to: core-metrics-results/unweighted-unifrac-group-significance.qzv
Saved Visualization to: alpha-rarefaction.qzv
Copy core-metrics folder outside of andromeda.
### outside of andromeda
scp -r emma_strand@bluewaves.uri.edu:/data/putnamlab/estrand/PointJudithData_16S/QIIME2_v6/alpha-rarefaction-30000.qzv  /Users/emmastrand/MyProjects/Cvir_Nut_Int/output/16S_allv6/QIIME2
scp -r emma_strand@bluewaves.uri.edu:/data/putnamlab/estrand/PointJudithData_16S/QIIME2_v6/core-metrics-results  /Users/emmastrand/MyProjects/Cvir_Nut_Int/output/16S_allv6/QIIME2
re-ran alpha rarefraction with higher cutoff
rarefraction.sh:
#!/bin/bash
#SBATCH -t 24:00:00
#SBATCH --nodes=1 --ntasks-per-node=1
#SBATCH --export=NONE
#SBATCH --mem=100GB
#SBATCH --mail-type=BEGIN,END,FAIL #email you when job starts, stops and/or fails
#SBATCH --mail-user=emma_strand@uri.edu #your email to send notifications
#SBATCH --account=putnamlab
#SBTACH -q putnamlab
#SBATCH -D /data/putnamlab/estrand/PointJudithData_16S/QIIME2_v6
#SBATCH --error="script_error_rarefraction" #if your job fails, the error report will be put in this file
#SBATCH --output="output_script_rarefraction" #once your job is completed, any final job report comments will be put in this file

source /usr/share/Modules/init/sh # load the module function
module load QIIME2/2021.4

# Metadata path
METADATA="metadata/PJ_V6Samples_Metadata.txt"

# This script calculates the rarefaction curve for the data
  qiime diversity alpha-rarefaction \
    --i-table classifier_trials/table-trained-filtered.qza \
    --i-phylogeny rooted-tree.qza \
    --p-max-depth 30000 \
    --m-metadata-file $METADATA \
    --o-visualization alpha-rarefaction-30000.qzv
In QIIME2 view, input alpha-rarefraction.qzv:


Where the gut samples start to level off (~20k) is the read depth we need to be sure we are capturing all the diversity that we can in these samples. Our lowest for the gut is around 29k so we are very confident that our sequencing is enough to observe all the features (ASVs) we need to make a strong statement about this dataset.
Statistics in R
Moved desired qza output files to a new directory downstream-analysis:
taxonomy-trained.qzatable.qzarooted-tree.qza
Convert qza files to tsv
convert.sh:
#!/bin/bash
#SBATCH -t 24:00:00
#SBATCH --nodes=1 --ntasks-per-node=1
#SBATCH --export=NONE
#SBATCH --mem=100GB
#SBATCH --mail-type=BEGIN,END,FAIL #email you when job starts, stops and/or fails
#SBATCH --mail-user=emma_strand@uri.edu #your email to send notifications
#SBATCH --account=putnamlab
#SBTACH -q putnamlab
#SBATCH -D /data/putnamlab/estrand/PointJudithData_16S/QIIME2_v6/downstream-analysis
#SBATCH --error="script_error_convert" #if your job fails, the error report will be put in this file
#SBATCH --output="output_script_convert" #once your job is completed, any final job report comments will be put in this file

source /usr/share/Modules/init/sh # load the module function
module load QIIME2/2021.4

cp ../classifier_trials/taxonomy-trained.qza .
cp ../rooted-tree.qza .
cp ../table.qza .

for i in *.qza; do
qiime tools export --input-path $i --output-path .
done
biom convert -i feature-table.biom -o feature-table-unfiltered.tsv --to-tsv
Output files: feature-table-unfiltered.tsv, feature-table.biom, taxonomy.tsv, and tree.nwk.
Copy these to github repo for analysis.
scp -r emma_strand@bluewaves.uri.edu:/data/putnamlab/estrand/PointJudithData_16S/QIIME2_v6/downstream-analysis /Users/emmastrand/MyProjects/Cvir_Nut_Int/output/16S_allv6/QIIME2
Link to our github repo. Pull this repo and you will find the files in downstream-analyses. We’ll take these files and work through Kevin’s script for analysis in R from QIIME2 output found here.
Questions for Rebecca:
- cut-off at 80 in trunc parameter
- subsampling depth
Troubleshooting
Denoising with incorrect primer length - not used, old script
I tried the following denoise parameters:
- With 7/7 bp trimming; 70/70 truncating (
denoise-7-70.sh) - With 10/10 bp trimming; 70/70 truncating (
denoise-10-70.sh) - With 7/7 bp trimming; 75/75 truncating (
denoise-7-75.sh) - With 10/10 bp trimming; 75/75 truncating (
denoise-10-75.sh)
denoise paramter trials
Output from these trials in this directory: PointJudithData_16S/QIIME2_v6/denoise_trials.
All parameter trials will have:
#SBATCH -D /data/putnamlab/estrand/PointJudithData_16S/QIIME2_v6/denoise_trials#SBATCH --error="script_error_denoise"with script name#SBATCH --output="output_script_denoise"with script name- Change paths for:
../PJ-paired-end-sequences.qza,../metadata #SBATCH --job-name="240-denoise"
copy denoise output to desktop.
scp -r emma_strand@bluewaves.uri.edu:/data/putnamlab/estrand/PointJudithData_16S/QIIME2_v6/denoise_trials /Users/emmastrand/MyProjects/Cvir_Nut_Int/output/16S_allv6/QIIME2/
Put the above files into QIIME2 view and download as tsv files.
Output from R script to visualize the above denoising statistics. R script: denoise-stats.R is in our Cvir repo.
Results from the trials above:


| Metric | Frequency | ||||||||
|---|---|---|---|---|---|---|---|---|---|
| Denoise parameter | Number of samples | Number of features | Total frequency | Minimum frequency | 1st quartile | Median frequency | 3rd quartile | Maximum frequency | Mean frequency |
| With 7/7 bp trimming; 75/75 truncating | 112 | 20,001 | 2,543,573 | 7,002.00 | 18,988.00 | 22,882.00 | 26,349.75 | 37,508.00 | 22,710.47 |
| With 7/7 bp trimming; 70/70 truncating | 112 | 20,436 | 2,948,899 | 8,332.00 | 23,258.00 | 26,196.50 | 29,486.75 | 45,743.00 | 26,329.46 |
| With 10/10 bp trimming; 75/75 truncating | 112 | 19,080 | 3,368,939 | 8,637.00 | 25,019.50 | 30,382.00 | 35,261.75 | 50,162.00 | 30,079.81 |
| With 10/10 bp trimming; 70/70 truncating | 112 | 20,375 | 3,990,135 | 10,343.00 | 30,931.50 | 34,976.00 | 40,619.25 | 57,437.00 | 35,626.21 |


Based on the above, I’m going with the script: - With 10/10 bp trimming; 70/70 truncating (denoise-10-70.sh).
Results from the trials above:
| Metric | Frequency | ||||||||
|---|---|---|---|---|---|---|---|---|---|
| Denoise parameter | Number of samples | Number of features | Total frequency | Minimum frequency | 1st quartile | Median frequency | 3rd quartile | Maximum frequency | Mean frequency |
| With 7/7 bp trimming; 75/75 truncating | 112 | 20,001 | 2,543,573 | 7,002.00 | 18,988.00 | 22,882.00 | 26,349.75 | 37,508.00 | 22,710.47 |
| With 7/7 bp trimming; 70/70 truncating | 112 | 20,436 | 2,948,899 | 8,332.00 | 23,258.00 | 26,196.50 | 29,486.75 | 45,743.00 | 26,329.46 |
| With 10/10 bp trimming; 75/75 truncating | 112 | 19,080 | 3,368,939 | 8,637.00 | 25,019.50 | 30,382.00 | 35,261.75 | 50,162.00 | 30,079.81 |
| With 10/10 bp trimming; 70/70 truncating | 112 | 20,375 | 3,990,135 | 10,343.00 | 30,931.50 | 34,976.00 | 40,619.25 | 57,437.00 | 35,626.21 |
Based on the above, I’m going with the script: - With 10/10 bp trimming; 70/70 truncating (denoise-10-70.sh).