
KBay Pairs 16S Analysis Pipeline
KBay Bleached Pairs 16S Sequencing Analysis Pipeline with QIIME2
This pipeline uses QIIME2. See this notebook post for the pipeline for using Mothur.
For more detailed pipeline and 16S information see:
- 16S Laboratory Protocol here.
- 16S pipeline workflow explained here from the Hawai’i Holobiont Integration project. If beginner to this workflow, I would recommend following this notebook post.
- Another example of 16S pipeline for Mo’orea E5 project here.
KBay Bleaching Pairs project
Project github: HI_Bleaching_Pairs
Molecular laboratory work spreadsheet: excel doc
40 adult coral biopsies of M. capitata used for molecular analysis from July 2019 and December 2019 time points. Laboratory work for this project found here.
Raw data path (not edit-able): ../../data/putnamlab/shared/ES_BP_16S
Raw data path (edit-able): ../../data/putnamlab/estrand/BleachingPairs_16S/raw_data
Output data path: ../../data/putnamlab/estrand/BleachingPairs_16S
Contents:
- Setting Up Andromeda
- FASTQC - Quality Control
- MultiQC Report
- Create metadata files
- QIIME2
- Troubleshooting
- Scripts
Setting Up Andromeda
Sign into andromeda: $ ssh -l emma_strand ssh3.hac.uri.edu.
Navigate to data folder (path for all following scripts): $ cd ../../data/putnamlab/shared/ES_BP_16S
Double check number files in the folder: $ ls -l | wc -l. The output should be 80 (1 reverse and 1 forward for each sample; 40 x 2 = 80 files).
Create conda environment
$ conda create -n KBay_16S
$ conda activate KBay_16S
FASTQC - Quality Control
Make new folders for output and scripts:
- Navigate to own username folder:
$ cd ../../data/putnamlab/estrand. - Make a new directory within own username for the outputs:
$ mkdir BleachingPairs_16S. - Navigate to the new directory:
$ cd BleachingPairs_16S. - Make a new directory for the raw data:
$ mkdir raw_data. - Make a new directory for the fastqc output in the new project folder:
$ mkdir fastqc_results. - Make a new directory for the scripts:
$ mkdir scripts.
Copy the raw data from the shared folder to the new ‘raw_data’ folder: $ cp /data/putnamlab/shared/ES_BP_16S/*fastq.gz /data/putnamlab/estrand/BleachingPairs_16S/raw_data.
Make a new script to run the FastQC program.
$ cd scripts
$ nano fastqc.sh

## copy and paste the below script into the file

#!/bin/bash
#SBATCH -t 24:00:00
#SBATCH --nodes=1 --ntasks-per-node=1
#SBATCH --export=NONE
#SBATCH --mem=100GB
#SBATCH --mail-type=BEGIN,END,FAIL #email you when job starts, stops and/or fails
#SBATCH --mail-user=emma_strand@uri.edu #your email to send notifications
#SBATCH --account=putnamlab
#SBATCH --error="script_error" #if your job fails, the error report will be put in this file
#SBATCH --output="output_script" #once your job is completed, any final job report comments will be put in this file

source /usr/share/Modules/init/sh # load the module function

module load FastQC/0.11.9-Java-11
module load MultiQC/1.9-intel-2020a-Python-3.8.2

cd /data/putnamlab/estrand/BleachingPairs_16S

for file in raw_data/*fastq.gz
do
fastqc $file --outdir fastqc_results
done

multiqc --interactive fastqc_results

mv multiqc_report.html BleachedPairs_16S_raw_qc_multiqc_report.html # renames file
Run the above script for the fastqc program and multiqc report output: $ sbatch fastqc.sh.
Check the status of a job: squeue -u emma_strand.
Move the multiqic file from andromeda to your computer to view in an internet browser.
$ scp emma_strand@bluewaves.uri.edu:/data/putnamlab/estrand/BleachingPairs_16S/BleachedPairs_16S_raw_qc_multiqc_report.html /Users/emmastrand/MyProjects/HI_Bleaching_Timeseries/data/16S/
MultiQC Report
General Statistics
| Sample Name | % Dups | % GC | Length | M Seqs |
|---|---|---|---|---|
| WSH217_S195_L001_R1_001 | 88.9% | 42% | 218 bp | 0.0 |
| WSH217_S195_L001_R2_001 | 75.2% | 43% | 222 bp | 0.0 |
| WSH218_S202_L001_R1_001 | 90.4% | 42% | 227 bp | 0.0 |
| WSH218_S202_L001_R2_001 | 78.4% | 42% | 231 bp | 0.0 |
| WSH219_S209_L001_R1_001 | 90.7% | 41% | 207 bp | 0.0 |
| WSH219_S209_L001_R2_001 | 80.7% | 41% | 213 bp | 0.0 |
| WSH220_S216_L001_R1_001 | 91.0% | 42% | 214 bp | 0.0 |
| WSH220_S216_L001_R2_001 | 77.8% | 42% | 221 bp | 0.0 |
| WSH221_S223_L001_R1_001 | 91.8% | 41% | 215 bp | 0.0 |
| WSH221_S223_L001_R2_001 | 82.3% | 41% | 221 bp | 0.0 |
| WSH222_S230_L001_R1_001 | 92.7% | 42% | 208 bp | 0.0 |
| WSH222_S230_L001_R2_001 | 83.6% | 42% | 213 bp | 0.0 |
| WSH223_S237_L001_R1_001 | 89.5% | 41% | 241 bp | 0.0 |
| WSH223_S237_L001_R2_001 | 79.3% | 42% | 245 bp | 0.0 |
| WSH224_S244_L001_R1_001 | 91.7% | 42% | 222 bp | 0.0 |
| WSH224_S244_L001_R2_001 | 80.8% | 42% | 227 bp | 0.0 |
| WSH225_S196_L001_R1_001 | 88.6% | 41% | 219 bp | 0.0 |
| WSH225_S196_L001_R2_001 | 78.5% | 42% | 223 bp | 0.0 |
| WSH226_S203_L001_R1_001 | 88.6% | 41% | 221 bp | 0.0 |
| WSH226_S203_L001_R2_001 | 79.3% | 42% | 224 bp | 0.0 |
| WSH227_S210_L001_R1_001 | 93.7% | 43% | 234 bp | 0.0 |
| WSH227_S210_L001_R2_001 | 90.4% | 43% | 237 bp | 0.0 |
| WSH228_S217_L001_R1_001 | 92.6% | 40% | 216 bp | 0.0 |
| WSH228_S217_L001_R2_001 | 85.2% | 41% | 221 bp | 0.0 |
| WSH229_S224_L001_R1_001 | 92.7% | 41% | 215 bp | 0.0 |
| WSH229_S224_L001_R2_001 | 85.3% | 42% | 219 bp | 0.0 |
| WSH230_S231_L001_R1_001 | 92.3% | 45% | 231 bp | 0.0 |
| WSH230_S231_L001_R2_001 | 85.5% | 46% | 235 bp | 0.0 |
| WSH231_S238_L001_R1_001 | 88.3% | 42% | 239 bp | 0.0 |
| WSH231_S238_L001_R2_001 | 79.8% | 44% | 242 bp | 0.0 |
| WSH232_S245_L001_R1_001 | 92.8% | 40% | 208 bp | 0.0 |
| WSH232_S245_L001_R2_001 | 87.4% | 41% | 212 bp | 0.0 |
| WSH233_S197_L001_R1_001 | 90.9% | 40% | 218 bp | 0.0 |
| WSH233_S197_L001_R2_001 | 82.6% | 42% | 222 bp | 0.0 |
| WSH234_S204_L001_R1_001 | 94.9% | 48% | 239 bp | 0.0 |
| WSH234_S204_L001_R2_001 | 90.5% | 48% | 242 bp | 0.0 |
| WSH235_S211_L001_R1_001 | 94.3% | 41% | 221 bp | 0.0 |
| WSH235_S211_L001_R2_001 | 87.2% | 41% | 227 bp | 0.0 |
| WSH236_S218_L001_R1_001 | 90.8% | 41% | 223 bp | 0.0 |
| WSH236_S218_L001_R2_001 | 79.5% | 43% | 228 bp | 0.0 |
| WSH237_S225_L001_R1_001 | 95.3% | 39% | 210 bp | 0.0 |
| WSH237_S225_L001_R2_001 | 90.8% | 40% | 216 bp | 0.0 |
| WSH238_S232_L001_R1_001 | 94.3% | 41% | 218 bp | 0.0 |
| WSH238_S232_L001_R2_001 | 88.3% | 41% | 223 bp | 0.0 |
| WSH239_S239_L001_R1_001 | 93.7% | 39% | 214 bp | 0.0 |
| WSH239_S239_L001_R2_001 | 89.7% | 40% | 220 bp | 0.0 |
| WSH240_S246_L001_R1_001 | 92.5% | 41% | 218 bp | 0.0 |
| WSH240_S246_L001_R2_001 | 84.8% | 41% | 222 bp | 0.0 |
| WSH241_S198_L001_R1_001 | 93.0% | 40% | 223 bp | 0.0 |
| WSH241_S198_L001_R2_001 | 84.9% | 40% | 232 bp | 0.0 |
| WSH242_S205_L001_R1_001 | 89.6% | 41% | 232 bp | 0.0 |
| WSH242_S205_L001_R2_001 | 83.6% | 41% | 236 bp | 0.0 |
| WSH243_S212_L001_R1_001 | 93.2% | 40% | 217 bp | 0.0 |
| WSH243_S212_L001_R2_001 | 87.3% | 40% | 223 bp | 0.0 |
| WSH244_S219_L001_R1_001 | 92.4% | 40% | 217 bp | 0.0 |
| WSH244_S219_L001_R2_001 | 84.5% | 41% | 224 bp | 0.0 |
| WSH245_S226_L001_R1_001 | 88.6% | 42% | 235 bp | 0.0 |
| WSH245_S226_L001_R2_001 | 78.6% | 43% | 240 bp | 0.0 |
| WSH246_S233_L001_R1_001 | 91.4% | 40% | 217 bp | 0.0 |
| WSH246_S233_L001_R2_001 | 84.3% | 41% | 222 bp | 0.0 |
| WSH247_S240_L001_R1_001 | 93.0% | 42% | 227 bp | 0.0 |
| WSH247_S240_L001_R2_001 | 88.6% | 43% | 232 bp | 0.0 |
| WSH248_S247_L001_R1_001 | 90.4% | 41% | 216 bp | 0.0 |
| WSH248_S247_L001_R2_001 | 82.1% | 41% | 220 bp | 0.0 |
| WSH249_S199_L001_R1_001 | 91.1% | 41% | 211 bp | 0.0 |
| WSH249_S199_L001_R2_001 | 84.3% | 42% | 215 bp | 0.0 |
| WSH250_S206_L001_R1_001 | 93.0% | 39% | 216 bp | 0.0 |
| WSH250_S206_L001_R2_001 | 88.3% | 40% | 221 bp | 0.0 |
| WSH251_S213_L001_R1_001 | 92.1% | 41% | 223 bp | 0.0 |
| WSH251_S213_L001_R2_001 | 85.6% | 41% | 228 bp | 0.0 |
| WSH252_S220_L001_R1_001 | 91.8% | 41% | 226 bp | 0.0 |
| WSH252_S220_L001_R2_001 | 82.6% | 41% | 231 bp | 0.0 |
| WSH253_S227_L001_R1_001 | 95.9% | 45% | 222 bp | 0.0 |
| WSH253_S227_L001_R2_001 | 92.7% | 45% | 227 bp | 0.0 |
| WSH254_S234_L001_R1_001 | 95.4% | 45% | 223 bp | 0.0 |
| WSH254_S234_L001_R2_001 | 92.5% | 45% | 227 bp | 0.0 |
| WSH255_S241_L001_R1_001 | 91.9% | 40% | 218 bp | 0.0 |
| WSH255_S241_L001_R2_001 | 86.0% | 41% | 223 bp | 0.0 |
| WSH256_S248_L001_R1_001 | 95.0% | 40% | 208 bp | 0.0 |
| WSH256_S248_L001_R2_001 | 91.7% | 40% | 213 bp | 0.0 |
Sequence counts

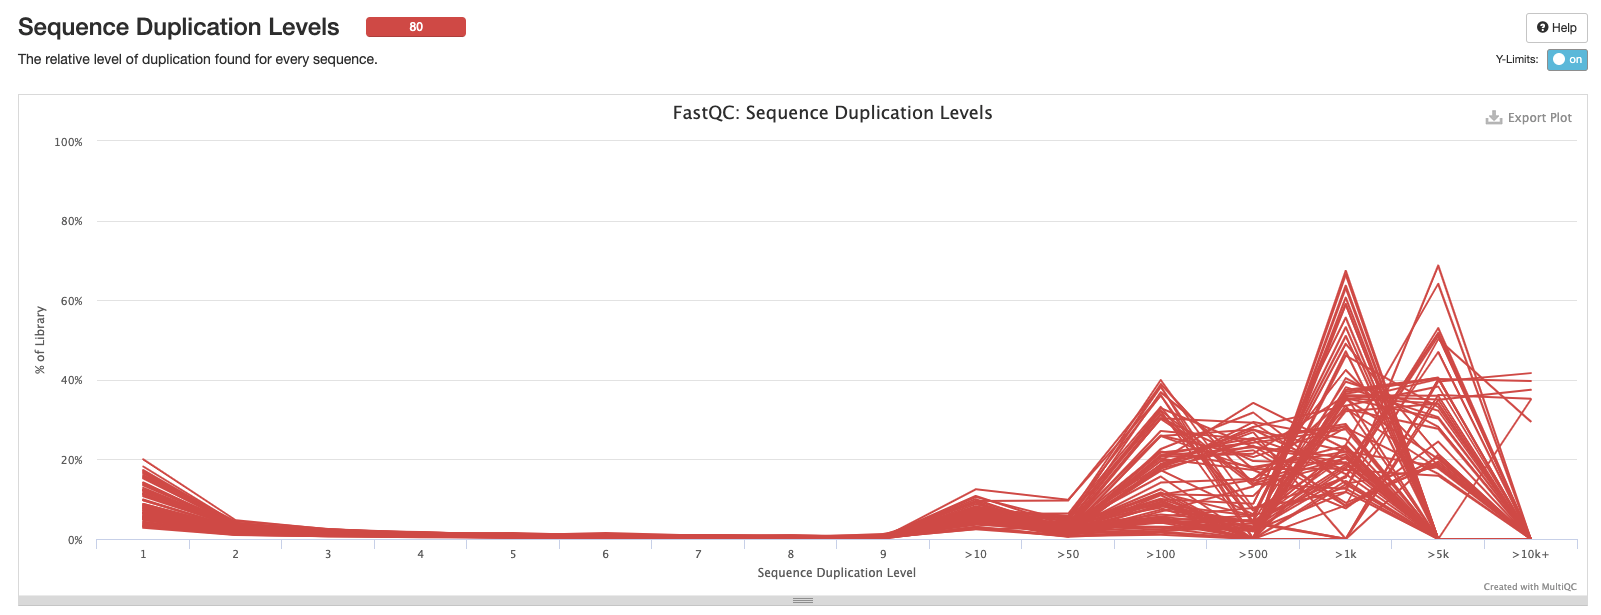
“Only sequences which first appear in the first 100,000 sequences in each file are analysed. This should be enough to get a good impression for the duplication levels in the whole file. Each sequence is tracked to the end of the file to give a representative count of the overall duplication level.”
Sequence quality

This statistic is what QIIME2 parameters will be based off of. Blue lines are reverse reads and red lines are forward reads.
Per Sequence Quality Scores

Per Base Sequence Content
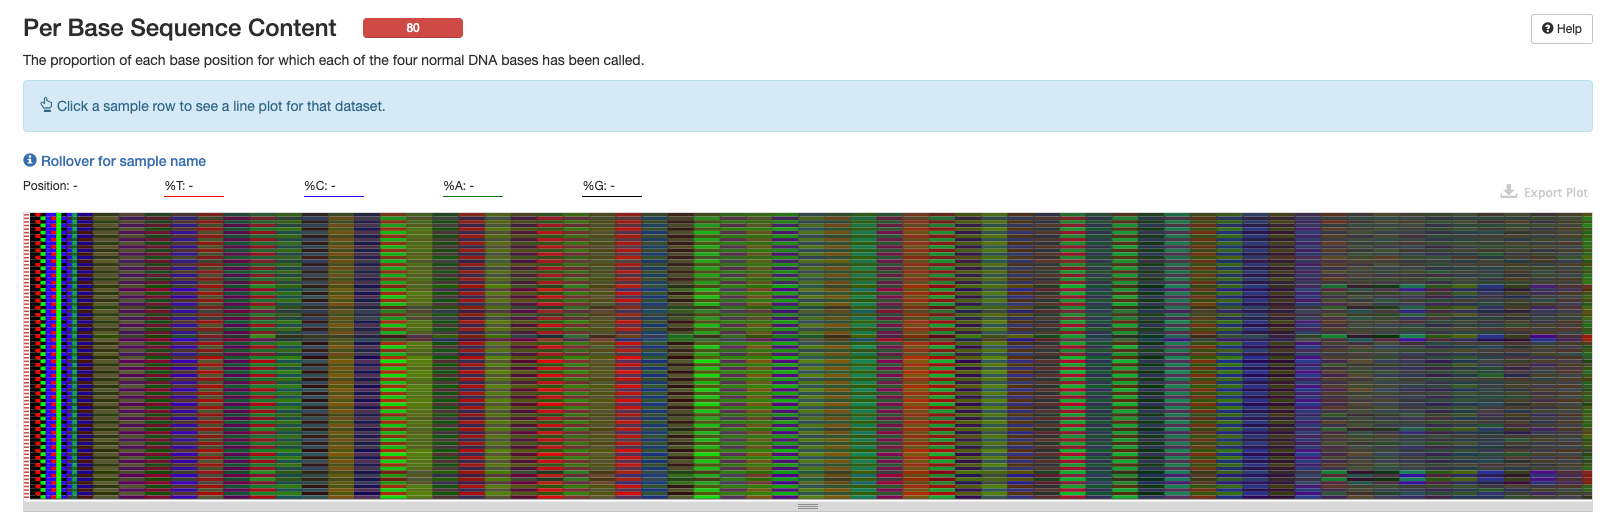
This plot is more helpful in the interactive version of the multiqc report.
Per Sequence GC Content

Per Base N Content

Sequence Length Distribution

Sequence Duplication Levels
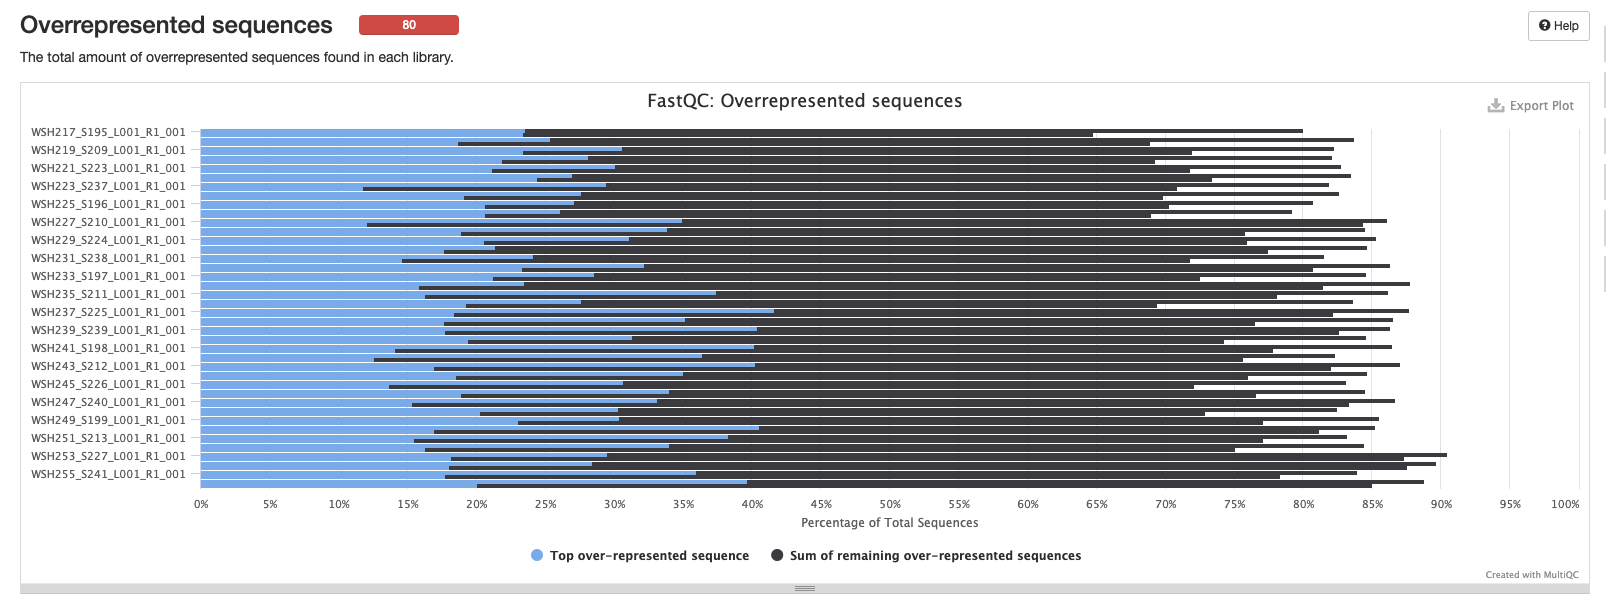
Overrepresented sequences
Adapter Content

Status Checks

Create metadata files
Metadata files created in both terminal and in an R script.
- R script file path in Github ‘HI_Bleaching_Timeseries’ repository: here on github and here at the bottom of this post.
Make a new directory for the metadata files:
$ cd ../../data/putnamlab/estrand/BleachingPairs_16S
$ mkdir metadata
1. Sample manifest file
QIIME2 2021.4 requires a sample manifest file (csv) like the one made in this analysis pipeline and the option PairedEndFastqManifestPhred33. QIIME2 2021.8 version requires a sample manifest file (txt) like the one made in the following steps and the option PairedEndFastqManifestPhred33V2. The new version of QIIME2 requires a column for the absolute path for the forward sequence file and another column for the absolute path for the reverse sequence file.
Create a list of the raw_data file names:
$ cd ../../data/putnamlab/estrand/BleachingPairs_16S
$ find raw_data -type f -print | sed 's_/_,_g' > metadata/filelist.csv
In a separate terminal window, outside of andromeda, copy this file to your computer to then work with in the above R script:
$ scp emma_strand@bluewaves.uri.edu:/data/putnamlab/estrand/BleachingPairs_16S/metadata/filelist.csv /Users/emmastrand/MyProjects/HI_Bleaching_Timeseries/data/16S/metadata/
Run the 1. Sample manifest file section in 16S_metadata.R file and then return to the following steps.
Secure copy paste the sample manifest file in a terminal window outside of andromeda.
$ scp /Users/emmastrand/MyProjects/HI_Bleaching_Timeseries/data/16S/metadata/sample_manifest.txt emma_strand@bluewaves.uri.edu:/data/putnamlab/estrand/BleachingPairs_16S/metadata
2. Sample metadata file
Run the 2. Sample metadata file section in 16S_metadata.R file and then return to the following steps.
Secure copy paste the metadata file in a terminal window outside of andromeda.
$ scp /Users/emmastrand/MyProjects/HI_Bleaching_Timeseries/data/16S/metadata/metadata.txt emma_strand@bluewaves.uri.edu:/data/putnamlab/estrand/BleachingPairs_16S/metadata
QIIME2
More detailed information on each step can be found in this notebook post (16S pipeline notes from Holobiont Integration Hawaii project).
1. Sample input
Create script for importing data into QIIME2. Make sure the conda environment created above is activated.
$ cd ../../data/putnamlab/estrand/BleachingPairs_16S/scripts
$ nano import.sh

## copy and paste below script

#!/bin/bash
#SBATCH -t 24:00:00
#SBATCH --nodes=1 --ntasks-per-node=1
#SBATCH --export=NONE
#SBATCH --mem=100GB
#SBATCH --mail-type=BEGIN,END,FAIL #email you when job starts, stops and/or fails
#SBATCH --mail-user=emma_strand@uri.edu #your email to send notifications
#SBATCH --account=putnamlab
#SBATCH --error="script_error" #if your job fails, the error report will be put in this file
#SBATCH --output="output_script" #once your job is completed, any final job report comments will be put in this file

source /usr/share/Modules/init/sh # load the module function
module load QIIME2/2021.8

#### METADATA FILES ####
# File path -- change this to correspond to what script you are running
cd /data/putnamlab/estrand/BleachingPairs_16S/

# Metadata path
METADATA="metadata/metadata.txt"

# Sample manifest path
MANIFEST="metadata/sample_manifest.txt"

#########################

qiime tools import \
  --type 'SampleData[PairedEndSequencesWithQuality]' \
  --input-path $MANIFEST \
  --input-format PairedEndFastqManifestPhred33V2 \
  --output-path KBay16S-paired-end-sequences.qza
2. QIIME2 denoising
Create a script for denosing and clustering. Prerequisites to running this script: run import.sh, activate conda environment, decide on denosing parameters, and load all metadata files to andromeda folders.
Based on sequence quality scores and the below image:
Parameters chosen:
--p-trunc-len-f: 19 (forward is 19 bp long)--p-trunc-len-r: 20 (reverse is 20 bp long)p-trim-left-f: try 260, 270, and 280p-trim-left-r: try 230, 240
Make a processed data folder for the output of denoising: $ mkdir processed_data.
forward 260, reverse 230 (most conservative)
Make an output folder for this script: $ mkdir denoise_260230.
$ cd ../../data/putnamlab/estrand/BleachingPairs_16S/scripts
$ nano denoise_260230.sh

## copy and paste the below into that script

#!/bin/bash
#SBATCH -t 24:00:00
#SBATCH --nodes=1 --ntasks-per-node=1
#SBATCH --export=NONE
#SBATCH --mem=100GB
#SBATCH --mail-type=BEGIN,END,FAIL #email you when job starts, stops and/or fails
#SBATCH --mail-user=emma_strand@uri.edu #your email to send notifications
#SBATCH --account=putnamlab
#SBATCH --error="script_error" #if your job fails, the error report will be put in this file
#SBATCH --output="output_script" #once your job is completed, any final job report comments will be put in this file

source /usr/share/Modules/init/sh # load the module function
module load QIIME2/2021.8

#### METADATA FILES ####
# File path -- change this to correspond to what script you are running
cd /data/putnamlab/estrand/BleachingPairs_16S/processed_data/denoise_260230

# Metadata path
METADATA="../../metadata/metadata.txt"

# Sample manifest path
MANIFEST="../../metadata/sample_manifest.txt"

#########################

qiime dada2 denoise-paired --verbose --i-demultiplexed-seqs ../../KBay16S-paired-end-sequences.qza \
  --p-trunc-len-r 230 --p-trunc-len-f 260 \
  --p-trim-left-r 20 --p-trim-left-f 19 \
  --o-table table_260230.qza \
  --o-representative-sequences rep-seqs_260230.qza \
  --o-denoising-stats denoising-stats_260230.qza \
  --p-n-threads 20

#### CLUSTERING

# Summarize feature table and sequences
qiime metadata tabulate \
  --m-input-file denoising-stats_260230.qza \
  --o-visualization denoising-stats_260230.qzv
qiime feature-table summarize \
  --i-table table_260230.qza \
  --o-visualization table_260230.qzv \
  --m-sample-metadata-file $METADATA
qiime feature-table tabulate-seqs \
  --i-data rep-seqs_260230.qza \
  --o-visualization rep-seqs_260230.qzv
forward 270, reverse 240 (middle)
Make an output folder for this script: $ mkdir denoise_270240.
$ cd ../../data/putnamlab/estrand/BleachingPairs_16S/scripts
$ nano denoise_270240.sh

## copy and paste the below into that script

#!/bin/bash
#SBATCH -t 24:00:00
#SBATCH --nodes=1 --ntasks-per-node=1
#SBATCH --export=NONE
#SBATCH --mem=100GB
#SBATCH --mail-type=BEGIN,END,FAIL #email you when job starts, stops and/or fails
#SBATCH --mail-user=emma_strand@uri.edu #your email to send notifications
#SBATCH --account=putnamlab
#SBATCH --error="script_error_270240" #if your job fails, the error report will be put in this file
#SBATCH --output="output_script_270240" #once your job is completed, any final job report comments will be put in this file

source /usr/share/Modules/init/sh # load the module function
module load QIIME2/2021.8

#### METADATA FILES ####
# File path -- change this to correspond to what script you are running
cd /data/putnamlab/estrand/BleachingPairs_16S/processed_data/denoise_270240

# Metadata path
METADATA="../../metadata/metadata.txt"

# Sample manifest path
MANIFEST="../../metadata/sample_manifest.txt"

#########################

qiime dada2 denoise-paired --verbose --i-demultiplexed-seqs ../../KBay16S-paired-end-sequences.qza \
  --p-trunc-len-r 240 --p-trunc-len-f 270 \
  --p-trim-left-r 20 --p-trim-left-f 19 \
  --o-table table_270240.qza \
  --o-representative-sequences rep-seqs_270240.qza \
  --o-denoising-stats denoising-stats_270240.qza \
  --p-n-threads 20

#### CLUSTERING

# Summarize feature table and sequences
qiime metadata tabulate \
  --m-input-file denoising-stats_270240.qza \
  --o-visualization denoising-stats_270240.qzv
qiime feature-table summarize \
  --i-table table_270240.qza \
  --o-visualization table_270240.qzv \
  --m-sample-metadata-file $METADATA
qiime feature-table tabulate-seqs \
  --i-data rep-seqs_270240.qza \
  --o-visualization rep-seqs_270240.qzv
forward 280, reverse 240 (least conservative)
Make an output folder for this script: $ mkdir denoise_280240.
$ cd ../../data/putnamlab/estrand/BleachingPairs_16S/scripts
$ nano denoise_280240.sh

## copy and paste the below into that script

#!/bin/bash
#SBATCH -t 24:00:00
#SBATCH --nodes=1 --ntasks-per-node=1
#SBATCH --export=NONE
#SBATCH --mem=100GB
#SBATCH --mail-type=BEGIN,END,FAIL #email you when job starts, stops and/or fails
#SBATCH --mail-user=emma_strand@uri.edu #your email to send notifications
#SBATCH --account=putnamlab
#SBATCH --error="script_error_280240" #if your job fails, the error report will be put in this file
#SBATCH --output="output_script_280240" #once your job is completed, any final job report comments will be put in this file

source /usr/share/Modules/init/sh # load the module function
module load QIIME2/2021.8

#### METADATA FILES ####
# File path -- change this to correspond to what script you are running
cd /data/putnamlab/estrand/BleachingPairs_16S/processed_data/denoise_280240

# Metadata path
METADATA="../../metadata/metadata.txt"

# Sample manifest path
MANIFEST="../../metadata/sample_manifest.txt"

#########################

qiime dada2 denoise-paired --verbose --i-demultiplexed-seqs ../../KBay16S-paired-end-sequences.qza \
  --p-trunc-len-r 240 --p-trunc-len-f 280 \
  --p-trim-left-r 20 --p-trim-left-f 19 \
  --o-table table_280240.qza \
  --o-representative-sequences rep-seqs_280240.qza \
  --o-denoising-stats denoising-stats_280240.qza \
  --p-n-threads 20

#### CLUSTERING

# Summarize feature table and sequences
qiime metadata tabulate \
  --m-input-file denoising-stats_280240.qza \
  --o-visualization denoising-stats_280240.qzv
qiime feature-table summarize \
  --i-table table_280240.qza \
  --o-visualization table_280240.qzv \
  --m-sample-metadata-file $METADATA
qiime feature-table tabulate-seqs \
  --i-data rep-seqs_280240.qza \
  --o-visualization rep-seqs_280240.qzv
Denoising statistics
In a separate terminal outside of andromeda, copy paste all three outputs (denoising-stats_######.qzv) to own computer to work with in R.
$ scp emma_strand@bluewaves.uri.edu:/data/putnamlab/estrand/BleachingPairs_16S/processed_data/denoise_260230/denoising-stats_260230.qzv /Users/emmastrand/MyProjects/HI_Bleaching_Timeseries/data/16S/processed_data/

$ scp emma_strand@bluewaves.uri.edu:/data/putnamlab/estrand/BleachingPairs_16S/processed_data/denoise_270240/denoising-stats_270240.qzv /Users/emmastrand/MyProjects/HI_Bleaching_Timeseries/data/16S/processed_data/

$ scp emma_strand@bluewaves.uri.edu:/data/putnamlab/estrand/BleachingPairs_16S/processed_data/denoise_280240/denoising-stats_280240.qzv /Users/emmastrand/MyProjects/HI_Bleaching_Timeseries/data/16S/processed_data/
Open qiime2 view and drop in the first file you want to view. Click ‘Download metadata TSV file’ and save that file to ‘~/MyProjects/HI_Bleaching_Timeseries/data/16S/processed_data’ folder.
Run the denoising stats portion of the ‘16S_metadata.R’ script and then return to the following steps below.
Number of reads that passed each denoising step:

Percentage of reads that passed each denoising stage:

Based on the above, I will choose to move forward with the most conservative (highest quality; forward 260; reverse 230) set of parameters because they also produced the highest number of reads and percentage of reads passing denoising steps.
3. QIIME2 taxonomic identification
Download the database file to the metadata folder on andromeda. We chose the Silva 138 99% OTUs from 515F/806R region of sequences (MD5: e05afad0fe87542704be96ff483824d4) as the classifier because we used 515F and 806RB primers for our sequences and QIIME2 recommends the classify-sklearn classifier trainer.
$ cd /data/putnamlab/estrand/BleachingPairs_16S/metadata

## Silva 138 99% OTUs from 515F/806R region of sequences
$ wget https://data.qiime2.org/2021.4/common/silva-138-99-515-806-nb-classifier.qza
## Silva 138 99% OTUs full-length sequences
$ wget https://data.qiime2.org/2021.11/common/silva-138-99-nb-classifier.qza

## Silva 138 SSURef NR99 full-length taxonomy
$ wget https://data.qiime2.org/2021.11/common/silva-138-99-tax.qza
## Silva 138 SSURef NR99 full-length sequences
$ wget https://data.qiime2.org/2021.11/common/silva-138-99-seqs.qza
We ran scripts with different databases and classifiers
2 classifier options: classify-sklearn and q2-feature-classifier.
*Left off right before creating separate script for q2 classifier. Keep looking into the difference between the sequence and taxonomy files vs the classifier file. Can also train classifier on own set of data.**
Create two folders for the taxonomic output.
$ mkdir filtered_taxonomy
$ mkdir unfiltered_taxonomy
Create script to run the taxonomic identification with the above database. One section filters the taxonomic identification table to remove chloroplast, eukaryota, and unassigned sequences. The other sections remains unfiltered so we can compare pre- and post- filtering.
$ cd ../../data/putnamlab/estrand/BleachingPairs_16S/scripts
$ nano taxonomy.sh

## copy and paste below script

#!/bin/bash
#SBATCH -t 24:00:00
#SBATCH --nodes=1 --ntasks-per-node=1
#SBATCH --export=NONE
#SBATCH --mem=100GB
#SBATCH --mail-type=BEGIN,END,FAIL #email you when job starts, stops and/or fails
#SBATCH --mail-user=emma_strand@uri.edu #your email to send notifications
#SBATCH --account=putnamlab
#SBATCH --error="script_error_taxonomy" #if your job fails, the error report will be put in this file
#SBATCH --output="output_script_taxonomy" #once your job is completed, any final job report comments will be put in this file

source /usr/share/Modules/init/sh # load the module function
module load QIIME2/2021.8

#### METADATA FILES ####
# File path -- change this to correspond to what script you are running
cd /data/putnamlab/estrand/BleachingPairs_16S/processed_data

# Metadata path
METADATA="../metadata/metadata.txt"

# Sample manifest path
MANIFEST="../metadata/sample_manifest.txt"

#########################

#### TAXONOMY CLASSIFICATION

qiime feature-classifier classify-sklearn \
  --i-classifier ../metadata/silva-138-99-515-806-nb-classifier.qza \
  --i-reads denoise_260230/rep-seqs_260230.qza \
  --o-classification taxonomy_260230.qza

## UNFILTERED

qiime metadata tabulate \
    --m-input-file taxonomy_260230.qza \
    --o-visualization taxonomy_260230.qzv
qiime taxa barplot \
    --i-table denoise_260230/table_260230.qza \
    --i-taxonomy taxonomy_260230.qza \
    --m-metadata-file $METADATA \
    --o-visualization unfiltered_taxonomy/taxa-bar-plots-unfiltered.qzv
qiime metadata tabulate \
    --m-input-file denoise_260230/rep-seqs_260230.qza \
    --m-input-file taxonomy_260230.qza \
    --o-visualization unfiltered_taxonomy/tabulated-feature-metadata.qzv

## FILTERED
qiime taxa filter-table \
     --i-table denoise_260230/table_260230.qza \
     --i-taxonomy taxonomy_260230.qza \
     --p-mode contains \
     --p-exclude "Unassigned","Chloroplast","Eukaryota" \
     --o-filtered-table filtered_taxonomy/table-filtered_260230.qza

qiime metadata tabulate \
    --m-input-file taxonomy_260230.qza \
    --o-visualization taxonomy_260230.qzv
qiime taxa barplot \
    --i-table filtered_taxonomy/table-filtered_260230.qza \
    --i-taxonomy taxonomy_260230.qza \
    --m-metadata-file $METADATA \
    --o-visualization filtered_taxonomy/taxa-bar-plots-filtered.qzv
qiime metadata tabulate \
    --m-input-file denoise_260230/rep-seqs_260230.qza \
    --m-input-file taxonomy_260230.qza \
    --o-visualization filtered_taxonomy/tabulated-feature-metadata.qzv
Secure copy paste these output files to github repo and computer to view in QIIME2 view.
# unfiltered
$ scp emma_strand@bluewaves.uri.edu:/data/putnamlab/estrand/BleachingPairs_16S/processed_data/unfiltered_taxonomy/taxa-bar-plots-unfiltered.qzv /Users/emmastrand/MyProjects/HI_Bleaching_Timeseries/data/16S/processed_data/

# filtered
$ scp emma_strand@bluewaves.uri.edu:/data/putnamlab/estrand/BleachingPairs_16S/processed_data/filtered_taxonomy/taxa-bar-plots-filtered.qzv /Users/emmastrand/MyProjects/HI_Bleaching_Timeseries/data/16S/processed_data/
Example of what the taxa bar plot file looks like in qiime2 view on level 4 classification:
Unfiltered

Filtered
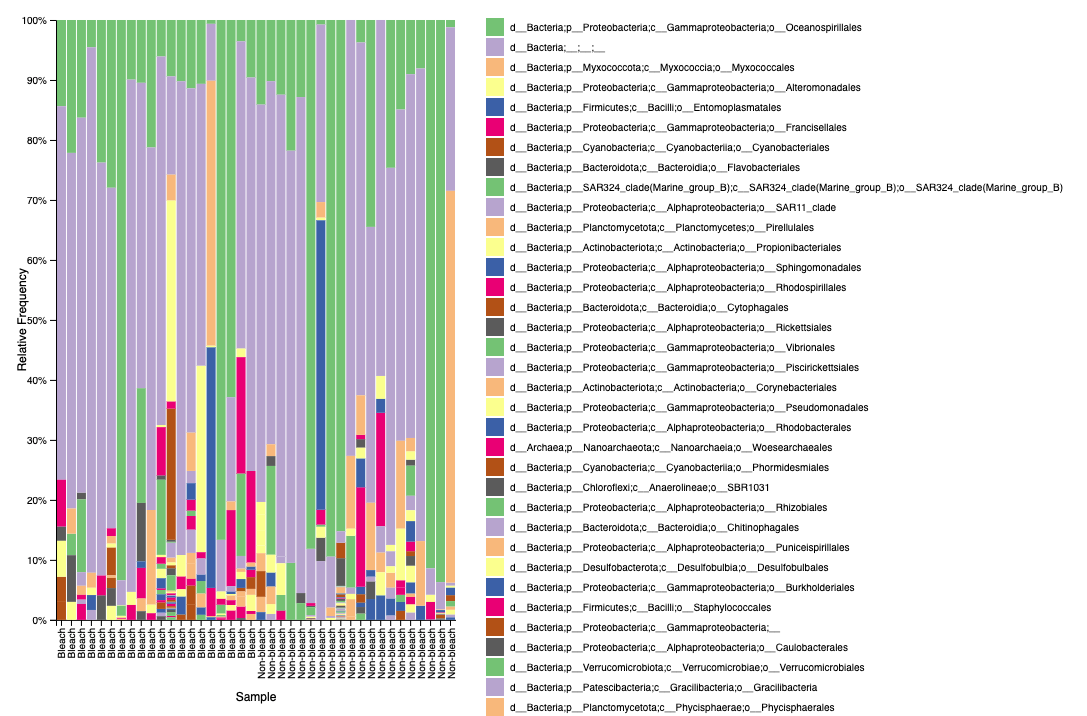
We see the same issue of unidentified bacteria in M. capitata.
4. QIIME2 phylogentic tree construction
To be done later.
5. QIIME2 diversity calculation
To be done later.
Troubleshooting
- In FASTQC - Quality Control section, the fastqc.sh script: I originally had the -D path as the raw data path but that is a protected folder that is not edit-able. I changed this to the BleachingPairs_16S folder within my own personal folder so that the ‘output_script’ and ‘script_error’ can be created.
- The fastqc.sh script was not running because of this error:
zsh: no matches found: ../../data/putnamlab/shared/ES_BP_16S/*fastq.gz. To fix this I copied the raw data files to a new folder in my own user and took out the following lines:# SBATCH -D data/putnamlab/estrand/BleachingPairs_16Sand all../../in front of the data path files. - I had several issues with the path formats within the fastqc.sh file - for the future follow exactly as the script above. cd to the folder you’re working in and then include the relative path in this script.
- Double check all paths and the correct “../../” is added where needed and taken out where not.
Scripts
Making metadata files in R
## Creating metadata files for 16S pipeline
## Emma Strand created 1/7/2022

library(plyr)
library(dplyr)
library(stringr)
library(tidyr)
library(readr)
library(ggplot2)

## 1. Sample manifest file
## filelist.csv created during pipeline in andromeda and scp to desktop to work with in R

file_names <- read.csv("~/MyProjects/HI_Bleaching_Timeseries/data/16S/metadata/filelist.csv", header = FALSE) %>%
  select(V2) %>% ## reading in filelist as dataframe and only the second column
  dplyr::rename(`absolute-filepath` = V2) # renaming to match the verbiage of qiime2

sample_manifest <- file_names # creating a new df based on the original file_names df
sample_manifest$path <- "/data/putnamlab/estrand/BleachingPairs_16S/raw_data/" #adding the absolute file path

sample_manifest <- sample_manifest %>% unite(`absolute-filepath`, path, `absolute-filepath`, sep = "") %>% # merging the two columns to complete the file path
  mutate(direction = case_when(grepl("R1", `absolute-filepath`) ~ "forward",
                               grepl("R2", `absolute-filepath`) ~ "reverse")) # creating a new column to state whether forward or reverse based on the R value in the sequence title name

sample_manifest$`sample-id` <- substr(sample_manifest$`absolute-filepath`, 53, 58) # creating a new column based on the sample id value

sample_manifest <- sample_manifest[, c(3, 1, 2)] # reordering the columns

sample_manifest <- sample_manifest %>% spread(direction, `absolute-filepath`) %>%
  dplyr::rename(`forward-absolute-filepath` = forward) %>%
  dplyr::rename(`reverse-absolute-filepath` = reverse)

write.table(sample_manifest, "~/MyProjects/HI_Bleaching_Timeseries/data/16S/metadata/sample_manifest.txt", sep = "\t", row.names = FALSE, quote = FALSE)

## return to terminal to secure copy paste the sample manifest file to bluewaves/andromeda folders

## 2. Sample metadata file
## sequencing ID and colonyID info downloaded from this google sheet: https://docs.google.com/spreadsheets/d/1lLvCp-RoRiBSGZ4NBPwi6cmZuozmfS20OJ7hBIueldU/edit#gid=0
collection.summary <- read.csv("~/MyProjects/HI_Bleaching_Timeseries/data/CollectionSummary.csv", header = TRUE) %>%
  select(-Biopsy., -Fragment.) %>% # removing 2 columns that are not needed for this metadata sheet
  dplyr::rename(Timepoint = Date)
collection.summary$Timepoint <- as.Date(collection.summary$Timepoint, format="%m/%d/%y")

sequencing.id <- read.csv("~/MyProjects/HI_Bleaching_Timeseries/data/16S/metadata/16S_sequencingID.csv", header = TRUE) %>%
  subset(Project == "ES_BP" & Type == "16S") %>% # selecting for just this 16S project's data and excluding Ariana and Kevin's
  dplyr::rename(ColonyID = Coral.ID) %>%
  select(Sample.ID, ColonyID, Timepoint) %>%
  mutate(Timepoint = case_when(
    Timepoint == "2019-07-20" ~ "2019-07-19",
    Timepoint == "2019-12-04" ~ "2019-12-04"))

sequencing.id$ColonyID <- sub(".","", sequencing.id$ColonyID)
sequencing.id$ColonyID <- sub(".","", sequencing.id$ColonyID) # do this twice to get rid of both the M and "-" symbol

collection.summary <- collection.summary %>% unite(Group, ColonyID, Timepoint, sep = " ")
sequencing.id <- sequencing.id %>% unite(Group, ColonyID, Timepoint, sep = " ")

metadata <- full_join(collection.summary, sequencing.id, by = "Group") %>% na.omit() %>%
  separate(Group, c("ColonyID", "Year", "Month", "Day")) %>%
  unite(Timepoint, Year, Month, sep = "-") %>% unite(Timepoint, Timepoint, Day, sep = "-")

metadata <- metadata %>% rename(`#SampleID` = Sample.ID)

metadata <- metadata[, c(7,1,2,3,4,5,6)] # reordering the columns

categories <- c("#q2:types", "categorical", "categorical", "categorical", "categorical",
                "categorical", "categorical") # QIIME2 needs each column to be specified

metadata <- rbind(metadata, categories)
metadata <- metadata[c(41,1:40),]

write.table(metadata, "~/MyProjects/HI_Bleaching_Timeseries/data/16S/metadata/metadata.txt", sep = "\t", row.names = FALSE, quote = FALSE)

# Denoising statistics
## comparing 3 options for denoising parameters

denoise_260230 <- read.table("~/MyProjects/HI_Bleaching_Timeseries/data/16S/processed_data/denoising-stats_260230.tsv", sep="\t", header = TRUE)
denoise_270240 <- read.table("~/MyProjects/HI_Bleaching_Timeseries/data/16S/processed_data/denoising-stats_270240.tsv", sep="\t", header = TRUE)
denoise_280240 <- read.table("~/MyProjects/HI_Bleaching_Timeseries/data/16S/processed_data/denoising-stats_280240.tsv", sep="\t", header = TRUE)

denoise_260230$parameter <- "260forward_230reverse"
denoise_270240$parameter <- "270forward_240reverse"
denoise_280240$parameter <- "280forward_240reverse"

denoising.stats <- union(denoise_260230, denoise_270240) %>% union(denoise_280240)

denoise.reads <- denoising.stats[, c(1,2,3,5,6,8,10)] # reordering columns to make it easier to plot
denoise.percent <- denoising.stats[, c(1,4,7,9,10)] # reordering columns to make it easier to plot

denoise.reads <- denoise.reads %>% gather(statistic, value, 2:6) # aggregates the three variables we are interested in to make it easier to plot
denoise.percent <- denoise.percent %>% gather(statistic, value, 2:4) # aggregates the three variables we are interested in to make it easier to plot

denoise.reads$statistic <- factor(denoise.reads$statistic, levels=c("input","filtered","denoised","merged","non.chimeric"))
denoise.percent$statistic <- factor(denoise.percent$statistic, levels=c("percentage.of.input.passed.filter", "percentage.of.input.merged",
                                                                        "percentage.of.input.non.chimeric"))

percent <- ggplot(data = denoise.percent, aes(x = parameter, y = value, group = parameter, color = parameter)) +
  theme_classic() + geom_boxplot() +
  facet_grid(~statistic, scales = "free") +
  theme(legend.position = "none") +
  ylab("# reads") +
  theme(axis.text.x = element_text(angle = 60, vjust = 1.2, hjust = 1.3)); denoise.plot #Set the text angle

reads <- ggplot(data = denoise.reads, aes(x = parameter, y = value, group = parameter, color = parameter)) +
  theme_classic() + geom_boxplot() +
  facet_grid(~statistic, scales = "free") +
  theme(legend.position = "none") +
  ylab("# reads") +
  theme(axis.text.x = element_text(angle = 60, vjust = 1.2, hjust = 1.3)); denoise.plot #Set the text angle

percent
reads

ggsave(file="~/MyProjects/HI_Bleaching_Timeseries/data/16S/processed_data/denoising-percent.png", percent, width = 11, height = 6, units = c("in"))
ggsave(file="~/MyProjects/HI_Bleaching_Timeseries/data/16S/processed_data/denoising-reads.png", reads, width = 11, height = 6, units = c("in"))