ImageJ Bleaching Analysis Protocol
Putnam Lab ImageJ Protocols
A series of analysis protocols in ImageJ.
Contents:
ImageJ Download
Download the ImageJ application from the National Institute of Health’s webpage: https://imagej.nih.gov/ij/download.html.
Bleaching_Score
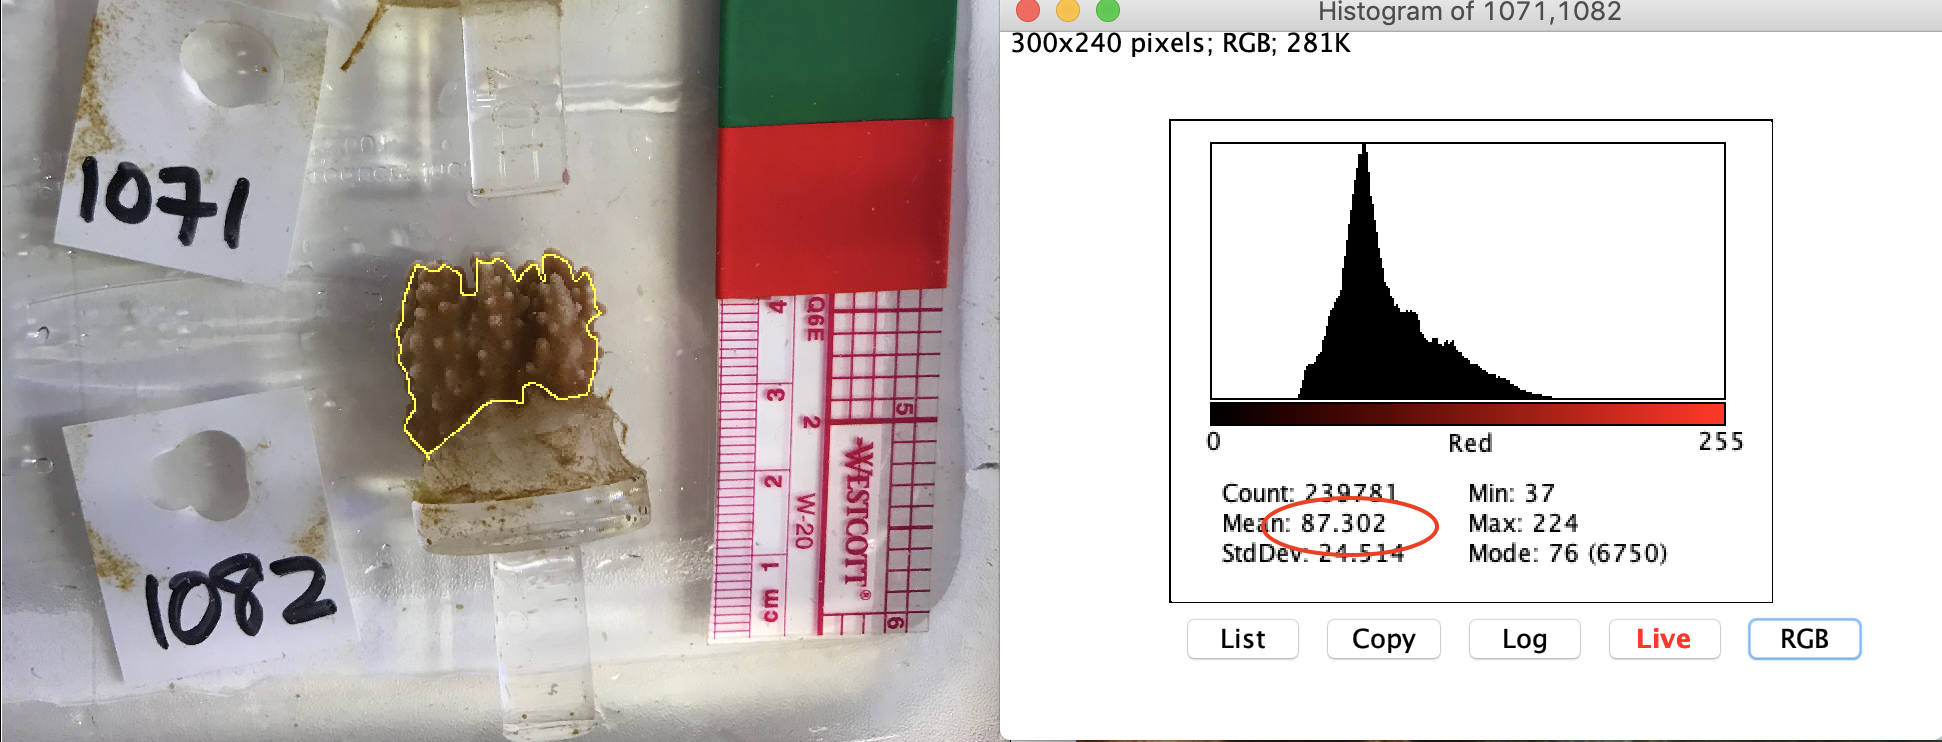
Goal: To quantify bleaching from images taken of coral fragments next to a red, blue, green color standard ruler. Protocol written to analyze images taken in the field for the 2018-2019 Holobiont Integration project.
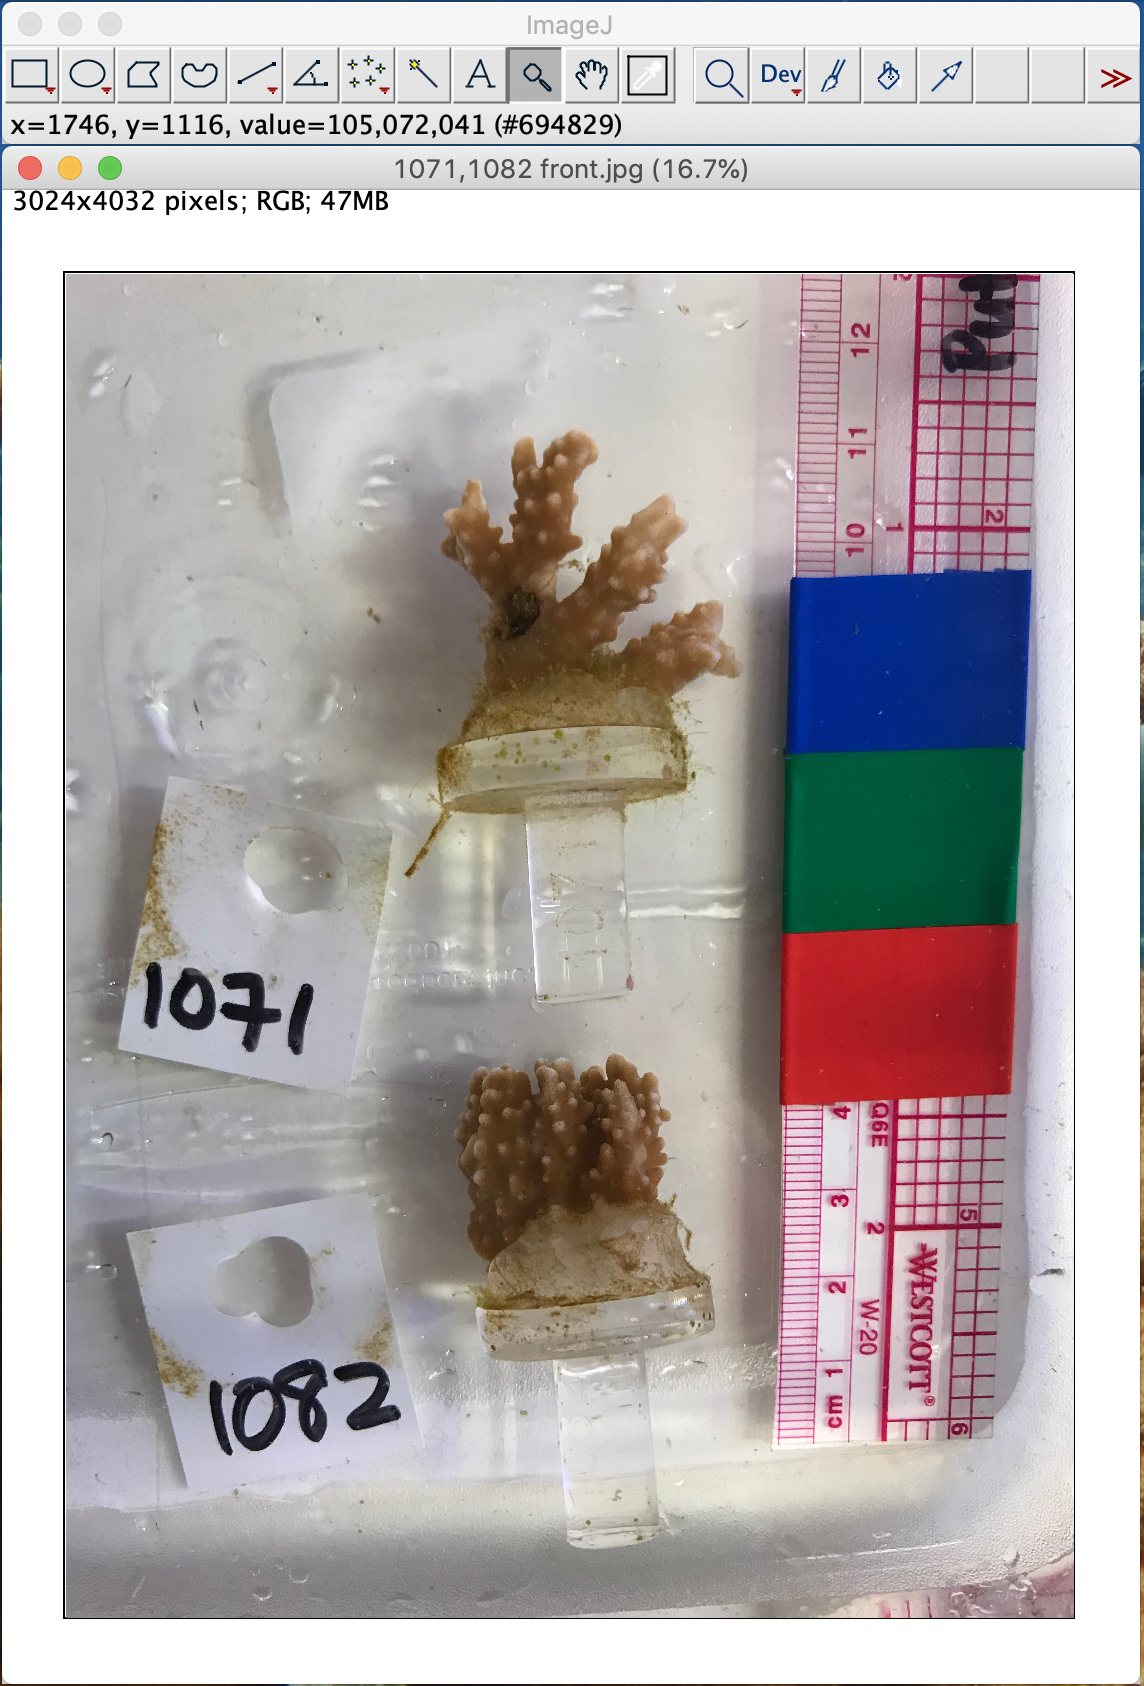
Image Example
Limit the amount of shadow and atypical light reflection by placing a piece of white paper behind the coral fragments. Place the red, blue, and green standard ruler behind the coral fragments. The water needs to be clean to avoid any particles blocking the coral standard ruler and/or coral fragments.
Quantifying Bleaching Score
- Open the ImageJ application. The application only appears as a tool bar until an image is opened.
- Open “Bleaching ImageJ” google spreadsheet.
- In ImageJ: “File” > “Open” > Choose the desired photo.
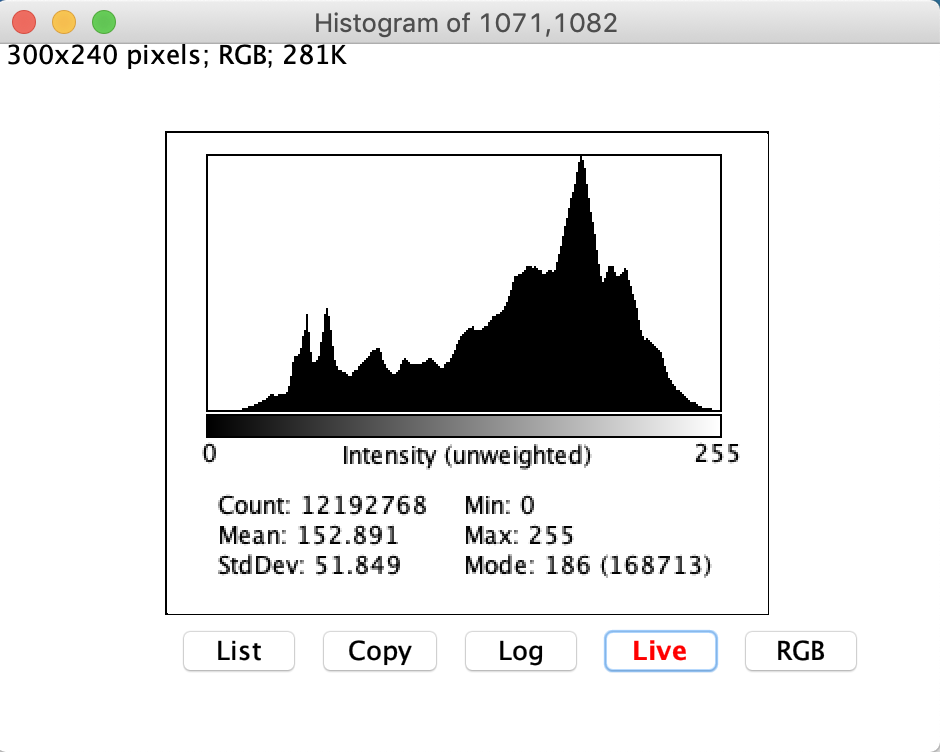
- Open the histogram analysis option: “Analyze” > Histogram.
- Click “Live” and “RGB”. Once in live, selecting different regions of the photo, the histogram will change intensity levels.
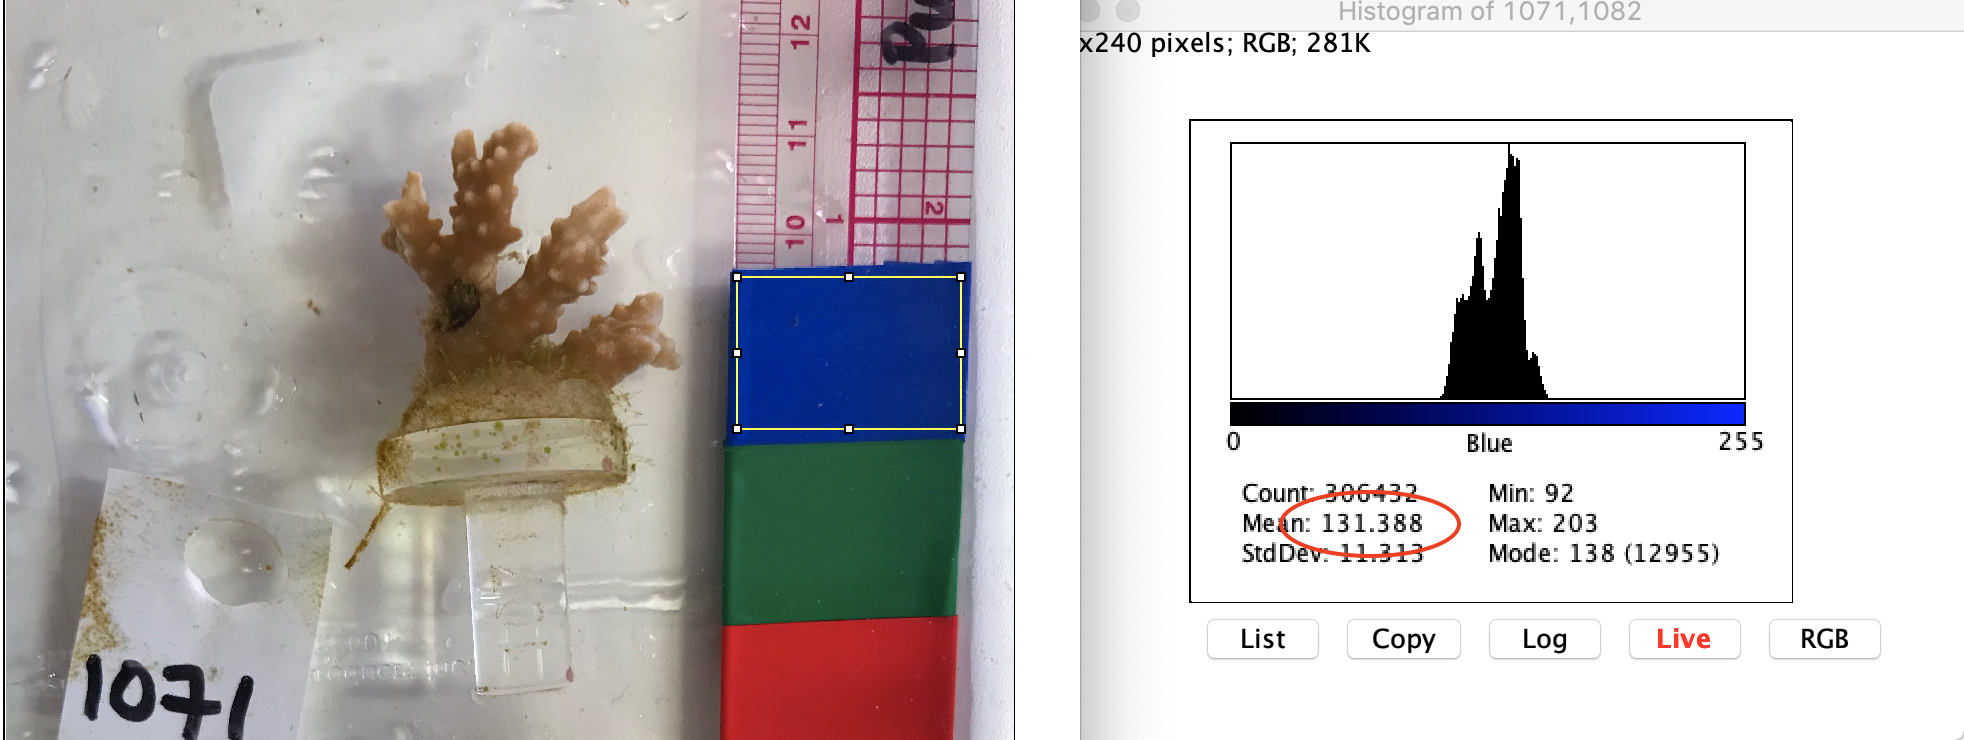
- Select each of the three color standards and record the mean value given by the histogram.
- Hover the mouse over a corner of the blue tape, right click to drag and select as much of the blue square as possible.
- On the histogram window, click through the “RGB” options: “Intensity (unweighted), Intensity (weighted), “R+G+B”, “Red”, “Green”, and stop at “Blue”. Record the Mean value in “Bleaching ImageJ” spreadsheet under “Blue.Standard”.
- Repeat steps previous steps for both the red and green tape squares. Stop at the “Red” histogram when analyzing the red square, stop at the “Green” histogram when analyzing the green square, and record the mean values under the respective Color.Standard column.
- Click the fourth drawing tool option on the main toolbar, freehand selections. Outline the LIVE coral tissue only. Do not select any portions of the coral fragment that have a shadow.
- On the histogram window, click through the “RGB” options to record the mean red, blue, and green color concentration.
Larvae_Size_Fecundity_Fertilization
Goal: To measure the size (diameter) of 50 eggs per photo, quantify fecundity by larval counts, and quantify fertilization by embryo counts.
- Open the ImageJ application. The application only appears as a tool bar until an image is opened.
- Open “Bleaching ImageJ” google spreadsheet.
- In ImageJ: “File” > “Open” > Choose the desired photo.
Egg Size
Fecundity
- Count all of the eggs in each photo.
- Record this total value in the spreadsheet.
Fertilization
- Count all of the larvae in each category:
- Unfertilized: one cell
- Cleaved embryos: 2 cells
- Cleaved embryos: 4 cells
- Cleaved embryos: 4+ cells
- Record each value in the spreadsheet.