
16s Analysis Pipeline
Holobiont Integration 16S V4 QIIME2 Analysis Pipeline
Lab protocol for 16S: here.
251 samples with the V4 region 515F and 806RB primers (Apprill et al 2015) from M. capitata and P. acuta samples in the Holobiont Integration project.
Sequenced at URI’s GSC. Information found here.
Platemap, sample IDs, and manifest sheet found here. Order name = Putnam_NGS_20210520_16sITS2_Wong_Strand. My samples start HPW060 - HPW322. Sample processing information for V4 Holobiont Integration can be found in the lab protocol link above.
General workflow
- Log into Andromeda using VPN if not on campus.
- cd to the 16S folder in the putnamlab folder
cd ../../data/putnamlab/estrand/HoloInt_16s - Start conda environment
conda activate HoloInt_16s - Fastqc on all seqs
sbatch fastqc.sh - View multiqc report (generated in #5) in internet browser.
- Create metadata files.
- Decide on parameters for all sections of QIIME2.
- Run qiime2.
- Switch to R
I left the “16s” in paths and notebook posts to not break any already established links. Use “16S” moving forward.
Contents:
- Setting Up Andromeda
- FastQC
- QIIME2 Metadata
- QIIME2 Sample data import
- QIIME2 Denoising with DADA2
- QIIME2 Taxonomy classification
- QIIME2 Subsample and diversity indices
- Switch to R to visualize the feature tables
Setting Up Andromeda
Related resources
Resources on creating ‘jobs’/scripts:
Bluewaves and Andromeda for URI
Logging into bluewaves and andromeda. Information for creating an account on Andromeda.
# Bluewaves
$ ssh -l username@bluewaves.uri.edu
$ pw: (your own password)

# Andromeda
$ ssh -l emma_strand ssh3.hac.uri.edu
Initial Upload
Hollie uploaded all files into the 16s HoloInt folder. Each sample will have a R1 and R2 fastq.gz file.
HPW### = Sample ID Number
S### =
L001 = Lane number
R1/R2 = Forward (R1) and reverse (R2) b/c they are paired end reads
001 = Read number
.fastq = fastq file format
.gz = gunzipped file format
$ cd ../../data/putnamlab/estrand/HoloInt_16s
$ ls

## first three lines

filenames_md5.txt                 HPW147_S174_L001_R1_001.fastq.gz  HPW235_S221_L001_R2_001.fastq.gz
HPW060_S44_L001_R1_001.fastq.gz   HPW147_S174_L001_R2_001.fastq.gz  HPW236_S233_L001_R1_001.fastq.gz
HPW060_S44_L001_R2_001.fastq.gz   HPW148_S186_L001_R1_001.fastq.gz  HPW236_S233_L001_R2_001.fastq.gz
CONDA Environment
Download miniconda.
Resources on using conda environments:
Create a conda environment
# Creating an environment to work in
$ conda create -n HoloInt_16s
  Proceed ([y]/n)?
$ y

# Activate the created environment
$ conda activate HoloInt_16s
When finished working, deactivate your conda environment.
$ conda deactivate HoloInt_16s
Every time you start working on the project again, you’ll need to reactivate the environment. The below line should start every command when the conda environment is activated.
(HoloInt_16s) [emma_strand@]/data/putnamlab/estrand/HoloInt_16s% $
Download all programs that you will need
Ask Kevin Bryan to download any programs you need and specify if you will be working on Andromeda or bluewaves. Andromeda and bluewaves have different versions of programs.
The command module avail lists all previously downloaded modules that you can use on whichever server you are logged into.
The command module list will list the programs currently loaded and ready to use. You must first ask Kevin Bryan to download that program onto the server, then when ready to use you must load that module into your conda environment to actually use it.
Make note of the ones you will use and add to each module to that function’s script.
The ones we used:
module load Miniconda3/4.9.2
module load FastQC/0.11.9-Java-11
module load MultiQC/1.9-intel-2020a-Python-3.8.2
module load cutadapt/2.10-GCCcore-9.3.0-Python-3.8.2
module load QIIME2/2021.4
FASTQC: Quality control of raw read files
Fastqc resources:
- https://github.com/s-andrews/FastQC
- https://raw.githubusercontent.com/s-andrews/FastQC/master/README.txt
- How to interpret fastqc results link
Create the report from all of the fastqc files using MultiQC.
Create a new directory for fastqc results
$ mkdir fastqc_results
$ cd fastqc_results
Write script to run fastqc
# Create script
$ cd scripts
$ nano fastqc.sh
Write script command: This will be on the putnamlab node and updates sent to my email.
#!/bin/bash
#SBATCH -t 24:00:00
#SBATCH --nodes=1 --ntasks-per-node=1
#SBATCH --export=NONE
#SBATCH --mem=100GB
#SBATCH --mail-type=BEGIN,END,FAIL #email you when job starts, stops and/or fails
#SBATCH --mail-user=emma_strand@uri.edu #your email to send notifications
#SBATCH --account=putnamlab
#SBATCH -D /data/putnamlab/estrand/HoloInt_16s/raw-data
#SBATCH --error="script_error" #if your job fails, the error report will be put in this file
#SBATCH --output="output_script" #once your job is completed, any final job report comments will be put in this file

source /usr/share/Modules/init/sh # load the module function

module load FastQC/0.11.9-Java-11
module load MultiQC/1.9-intel-2020a-Python-3.8.2

for file in /data/putnamlab/estrand/HoloInt_16s/raw-data/*fastq.gz
do
fastqc $file --outdir /data/putnamlab/estrand/HoloInt_16s/fastqc_results
done

multiqc --interactive fastqc_results

mv multiqc_report.html 16S_raw_qc_multiqc_report_ES.html #renames file
To check the status of any job you are running
squeue --start
Run fastqc
Run script outlined. When the script either fails or finishes, the email included in the slurm sh code will sent a notification.
$ cd [to the HoloInt_16s folder]
$ sbatch /data/putnamlab/estrand/HoloInt_16s/scripts/fastqc.sh

# Check the wait list for running scripts
$ squeue
Double check all files were processed. Output should be 251 x 2 (F and R reads) x 2 (html and zip file) = 1004.
$ cd fastqc_results
$ ls -1 | wc -l

output:
1004
Troubleshooting during module load and fastqc steps
How to check where an error occured in your script.
$ nano script_error
The first time I ran the .sh scripts for fastqc and module loading I got an error message that the function ‘fastqc’ and ‘module’ wasn’t recognized. Once I added this line source /usr/share/Modules/init/sh to the slurm script, then the scripts worked.
I tried to add #!/usr/bin/zsh to the beginning of my script for my slurm jobs to run. Instead of #!/bin/bash. But this didn’t work. I canged it back to bash.
I need to have the module load within each script not loading them all before and include the source module line above in every script.
Multiqc report: visualization of fastqc
Copy the report to your home desktop so that you are able to open this report. Run this outside of Andromeda and use the bluewaves login.
$ scp emma_strand@bluewaves.uri.edu:/data/putnamlab/estrand/HoloInt_16s/multiqc_report_interactive.html /Users/emmastrand/MyProjects/Acclim_Dynamics/16S_seq/ES-run
Raw QC Results
Link to the qc report in our github repo: Acclim Dynamics 16s multiqc.
How to interpret MultiQC Reports video.
General notes:
- Sequence Counts: HPW270 has very little reads
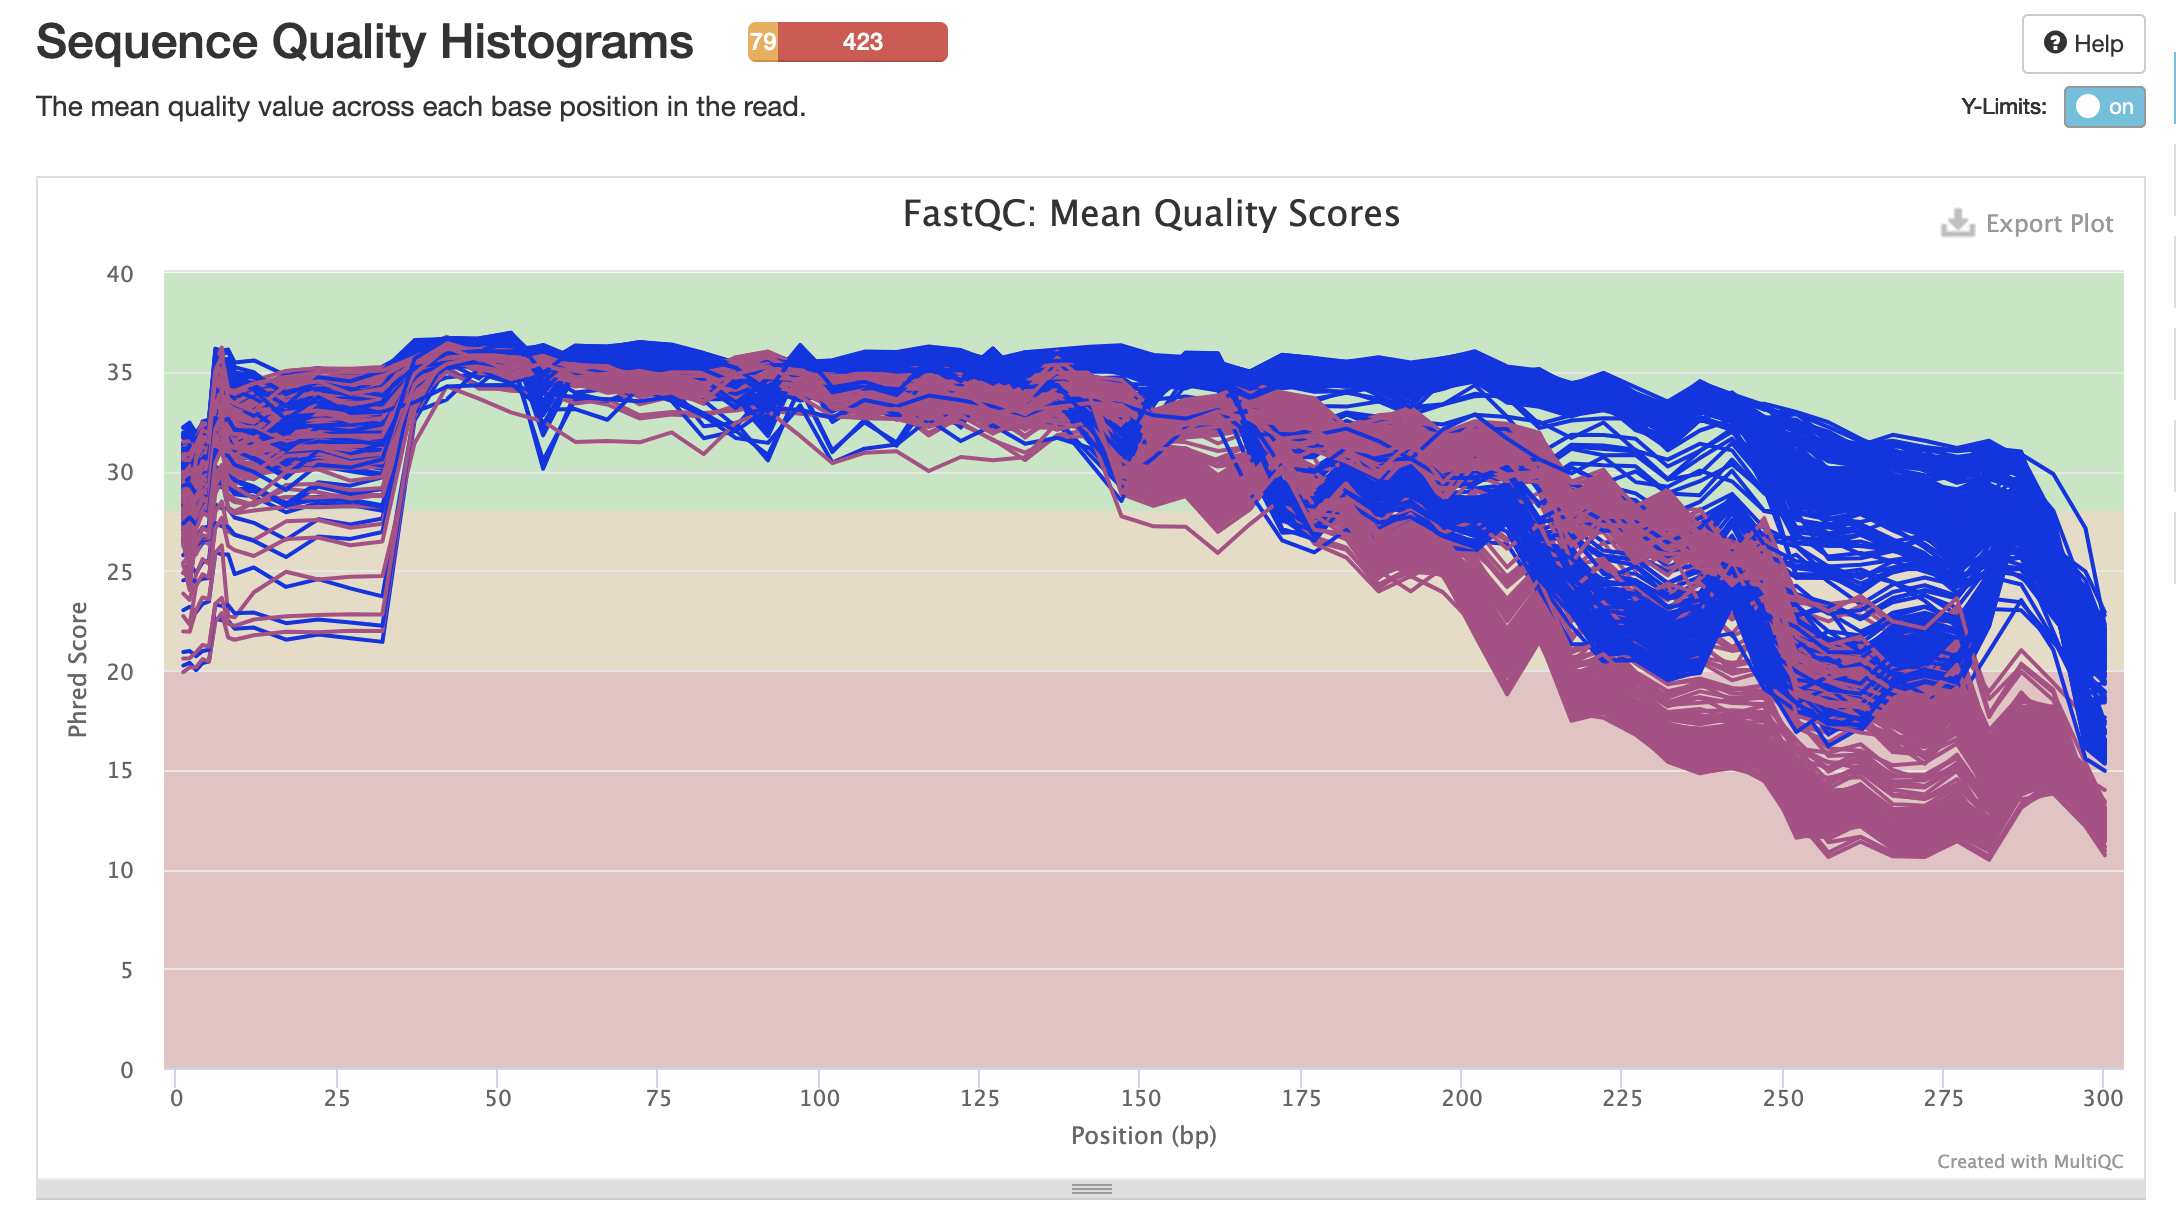
- Good mean quality scores start around 40-50 bp and drop around 175 bp (important for quality trimming later)
- Per sequence GC content has three main peaks instead of a normal distribution
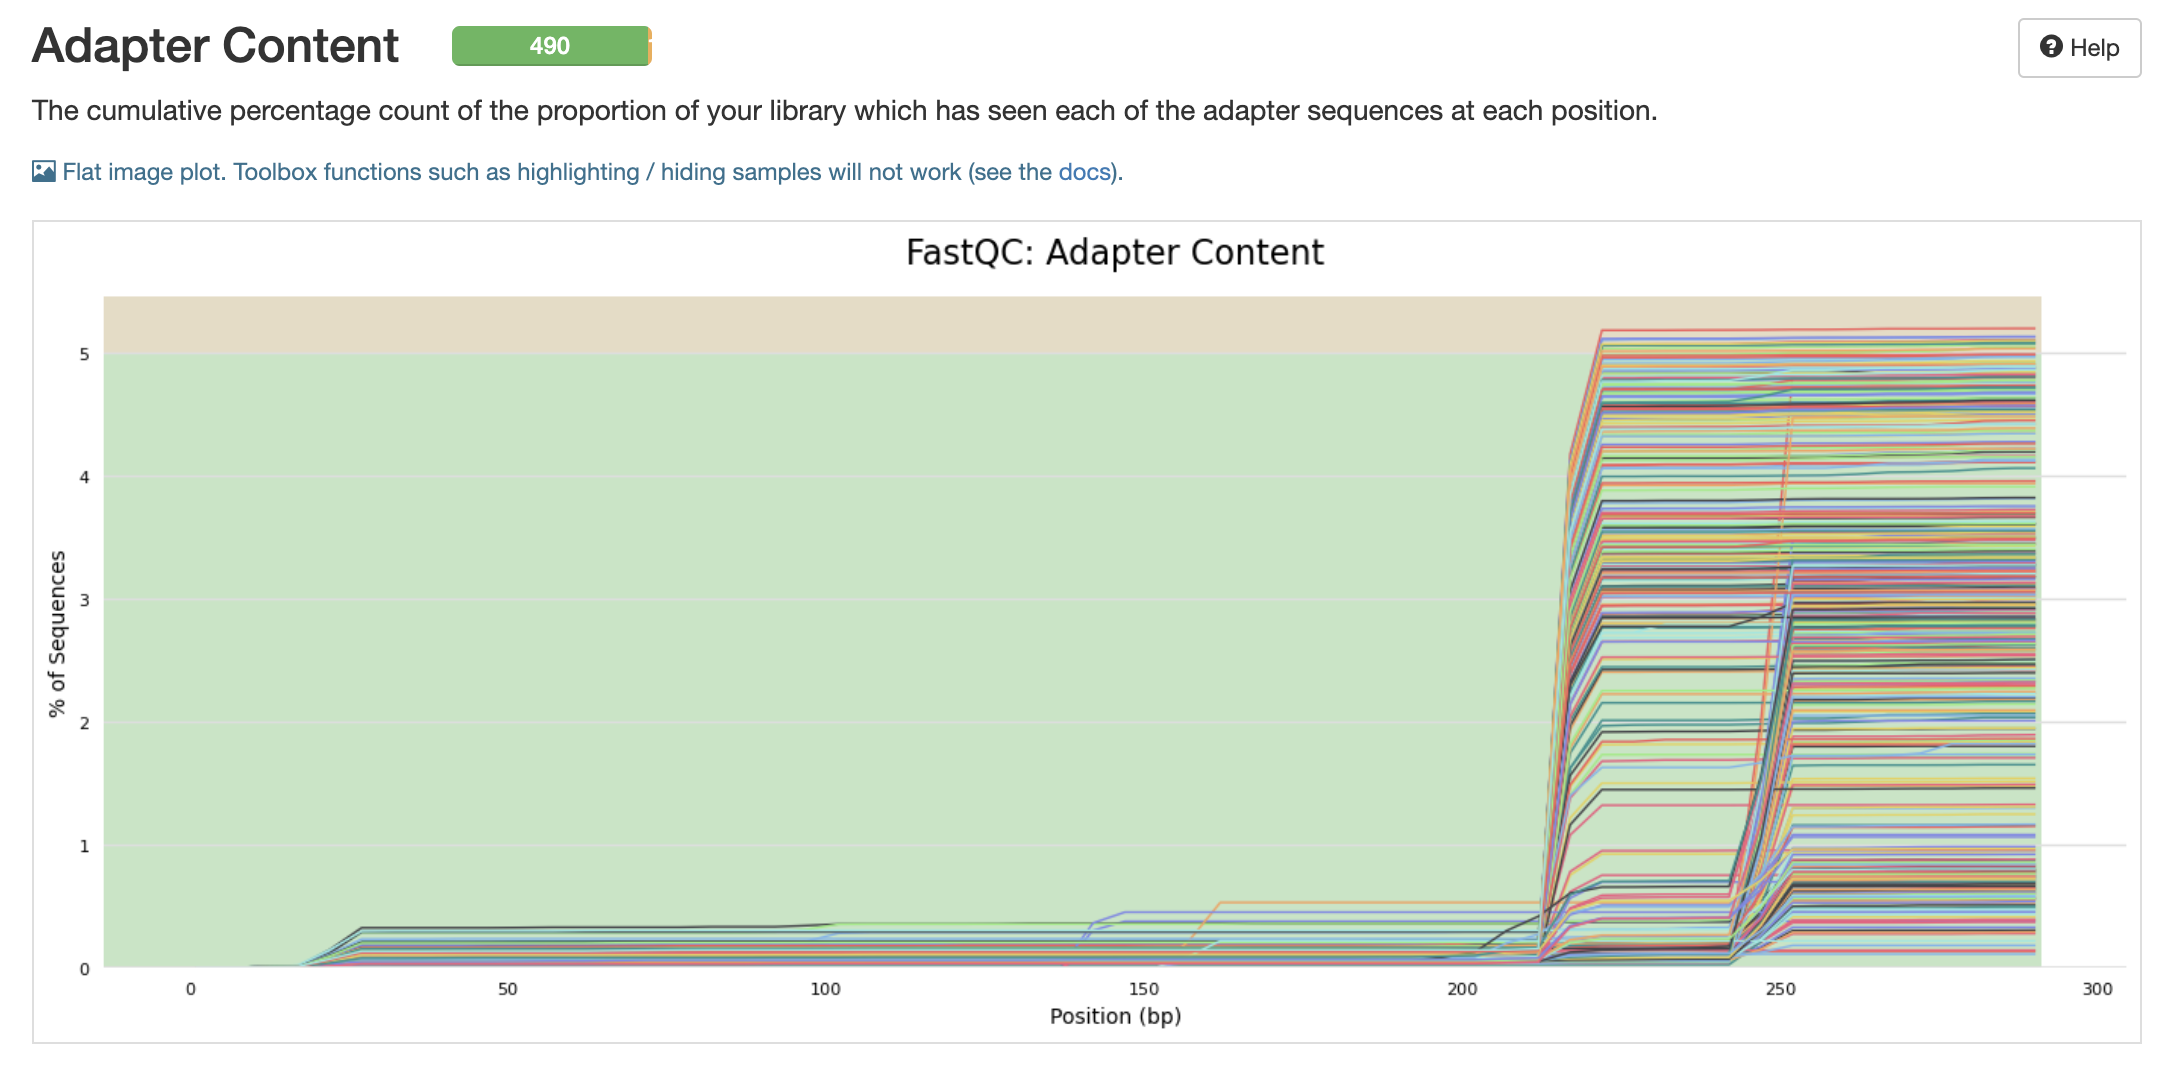
- Adapter content 210 - 290. These need to be cut out
Per sequence GC content:
- High GC can give you G-runs in primers or products. 3 or more Gs in a run may result in intermolecular quadruplexes forming in the PCR mix before or during amplification (link)
- Seems to be an artifact of PCR
QIIME2
Program webpage here, beginners guide here.
Read the above links thoroughly before continuing on.
I wrote one script to complete the following steps in QIIME2:
- Import metadata files (2)
- Import sample data
- Quality control with DADA2
- Clustering methods
- Taxonomy classification based on imported database
Import metadata files
Create metadata directory
$ cd [to the general HoloInt_16s folder]
$ mkdir metadata
Creating a list of all raw files
In a separate terminal window, not logged into Andromeda, secure copy these files.
# In andromeda
$ find raw_files -type f -print | sed 's_/_,_g' > ~/filelist.csv
$ mv ~/filelist.csv /data/putnamlab/estrand/HoloInt_16s

# Outside of andromeda
$ scp emma_strand@bluewaves.uri.edu:/data/putnamlab/estrand/HoloInt_16s/filelist.csv /Users/emmastrand/MyProjects/Acclim_Dynamics/16S_seq/
Start with two metadata files
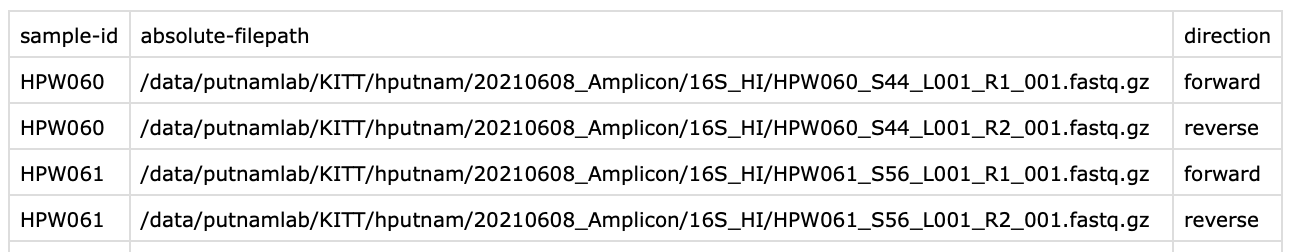
I. Sample manifest file
QIIME2 instructions on a sample manifest file here under ‘Fastq manifest formats’.
Created in the 16s.Rmd script. Secure copy this file outside of andromeda.
$ scp /Users/emmastrand/MyProjects/Acclim_Dynamics/16S_seq/ES-run/HoloInt_sample-manifest-ES.csv emma_strand@bluewaves.uri.edu:/data/putnamlab/estrand/HoloInt_16s/metadata
Example of a sample manifest:
II. Sample metadata file
The metadata will have all the experimental data you need to make comparisons. The first row will be the headers and the 2nd row will be the type of data each column is.
Metadata formatting requirements here.
Example of metadata:

Secure copy this file outside of andromeda.
$ scp /Users/emmastrand/MyProjects/Acclim_Dynamics/16S_seq/HoloInt_Metadata.txt emma_strand@bluewaves.uri.edu:/data/putnamlab/estrand/HoloInt_16s/metadata
Sample data import
General sample Input information from QIIME2: here. We chose the below for our samples:
- Sequence Data with Sequence Quality Information: because we have fastq files, not fasta files.
- FASTQ data in the Casava 1.8 paired-end demultiplexed format: because our samples are already demultiplexed and we have 1 file per F and R.
- Script format came from here.
- PairedEndFastqManifestPhred33 option requires a forward and reverse read. This assumes that the PHRED (more info on that here) offset for positional quality scores is 33.
import.sh
#!/bin/bash
#SBATCH -t 24:00:00
#SBATCH --nodes=1 --ntasks-per-node=1
#SBATCH --export=NONE
#SBATCH --mem=100GB
#SBATCH --mail-type=BEGIN,END,FAIL #email you when job starts, stops and/or fails
#SBATCH --mail-user=emma_strand@uri.edu #your email to send notifications
#SBATCH --account=putnamlab
#SBTACH -q putnamlab
#SBATCH -D /data/putnamlab/estrand/HoloInt_16s
#SBATCH --error="script_error_import" #if your job fails, the error report will be put in this file
#SBATCH --output="output_script_import" #once your job is completed, any final job report comments will be put in this file

source /usr/share/Modules/init/sh # load the module function
module load QIIME2/2021.4

#### METADATA FILES ####
# File path -- change this to correspond to what script you are running
cd /data/putnamlab/estrand/HoloInt_16s/

# Metadata path
METADATA="metadata/HoloInt_Metadata.txt"

# Sample manifest path
MANIFEST="metadata/HoloInt_sample-manifest-ES.csv"

#########################

qiime tools import \
  --type 'SampleData[PairedEndSequencesWithQuality]' \
  --input-path $MANIFEST \
  --input-format PairedEndFastqManifestPhred33 \
  --output-path HoloInt_16S-paired-end-sequences.qza
Output from output_script_import:
$ less output_script_import
Imported metadata/HoloInt_sample-manifest-ES.csv as PairedEndFastqManifestPhred33 to HoloInt_16S-paired-end-sequences.qza
HoloInt_16S-paired-end-sequences.qza is the output file that we will input in the next denoising step.
Denoising with DADA2 and Clustering
Description from QIIME2 documentation:
- We denoise our sequences to remove and/or correct noisy reads.
- To put it simply, these methods filter out noisy sequences, correct errors in marginal sequences (in the case of DADA2), remove chimeric sequences, remove singletons, join denoised paired-end reads (in the case of DADA2), and then dereplicate those sequences.
Full DADA2 options from qiime2 on this page: here
Parameter Definitions:
--i-demultiplexed-seqsfollowed by the sequences artifact to be denoised--p-trunc-len-f INTEGER: position to be truncated due to decreased quality. This truncates the 3’ end of sequences which are the bases that were sequenced in the last cycles. On the forward read.--p-trunc-len-r INTEGER: same as above but on the reverse read.p-trim-left-f INTEGER: Position at which forward read sequences should be trimmed due to primer length. This trims the 5’ end of the input sequences, which will be the bases that were sequenced in the first cycles.p-trim-left-r INTEGER: Position at which reverse read sequences should be trimmed due to primer length. This trims the 5’ end of the input sequences, which will be the bases that were sequenced in the first cycles.o-table: The resulting feature table.o-representative-sequences: The resulting feature sequences. Each feature in the feature table will be represented by exactly one sequence, and these sequences will be the joined paired-end sequences.o-denoising-stats: SampleData[DADA2Stats]p-n-threads: The number of threads to use for multithreaded processing. If 0 is provided, all available cores will be used. Helpful page on what multithreaded processing is.
Parameter choices for our data:
- Resources: forum post, exercises in picking trunc and left values, video on denoising/clustering in QIIME2.
- Video example of denoising from QIIME2 youtube.
pre-filtering sequence quality scores
Blue sequences = forward
Pink sequences = reverse
pre-filtering adapter content
p-n-threads choice: 20 because this will give us multi-thread processing capability to speed up the qiime2 pipeline but won’t take all available threads on the putnam lab node.
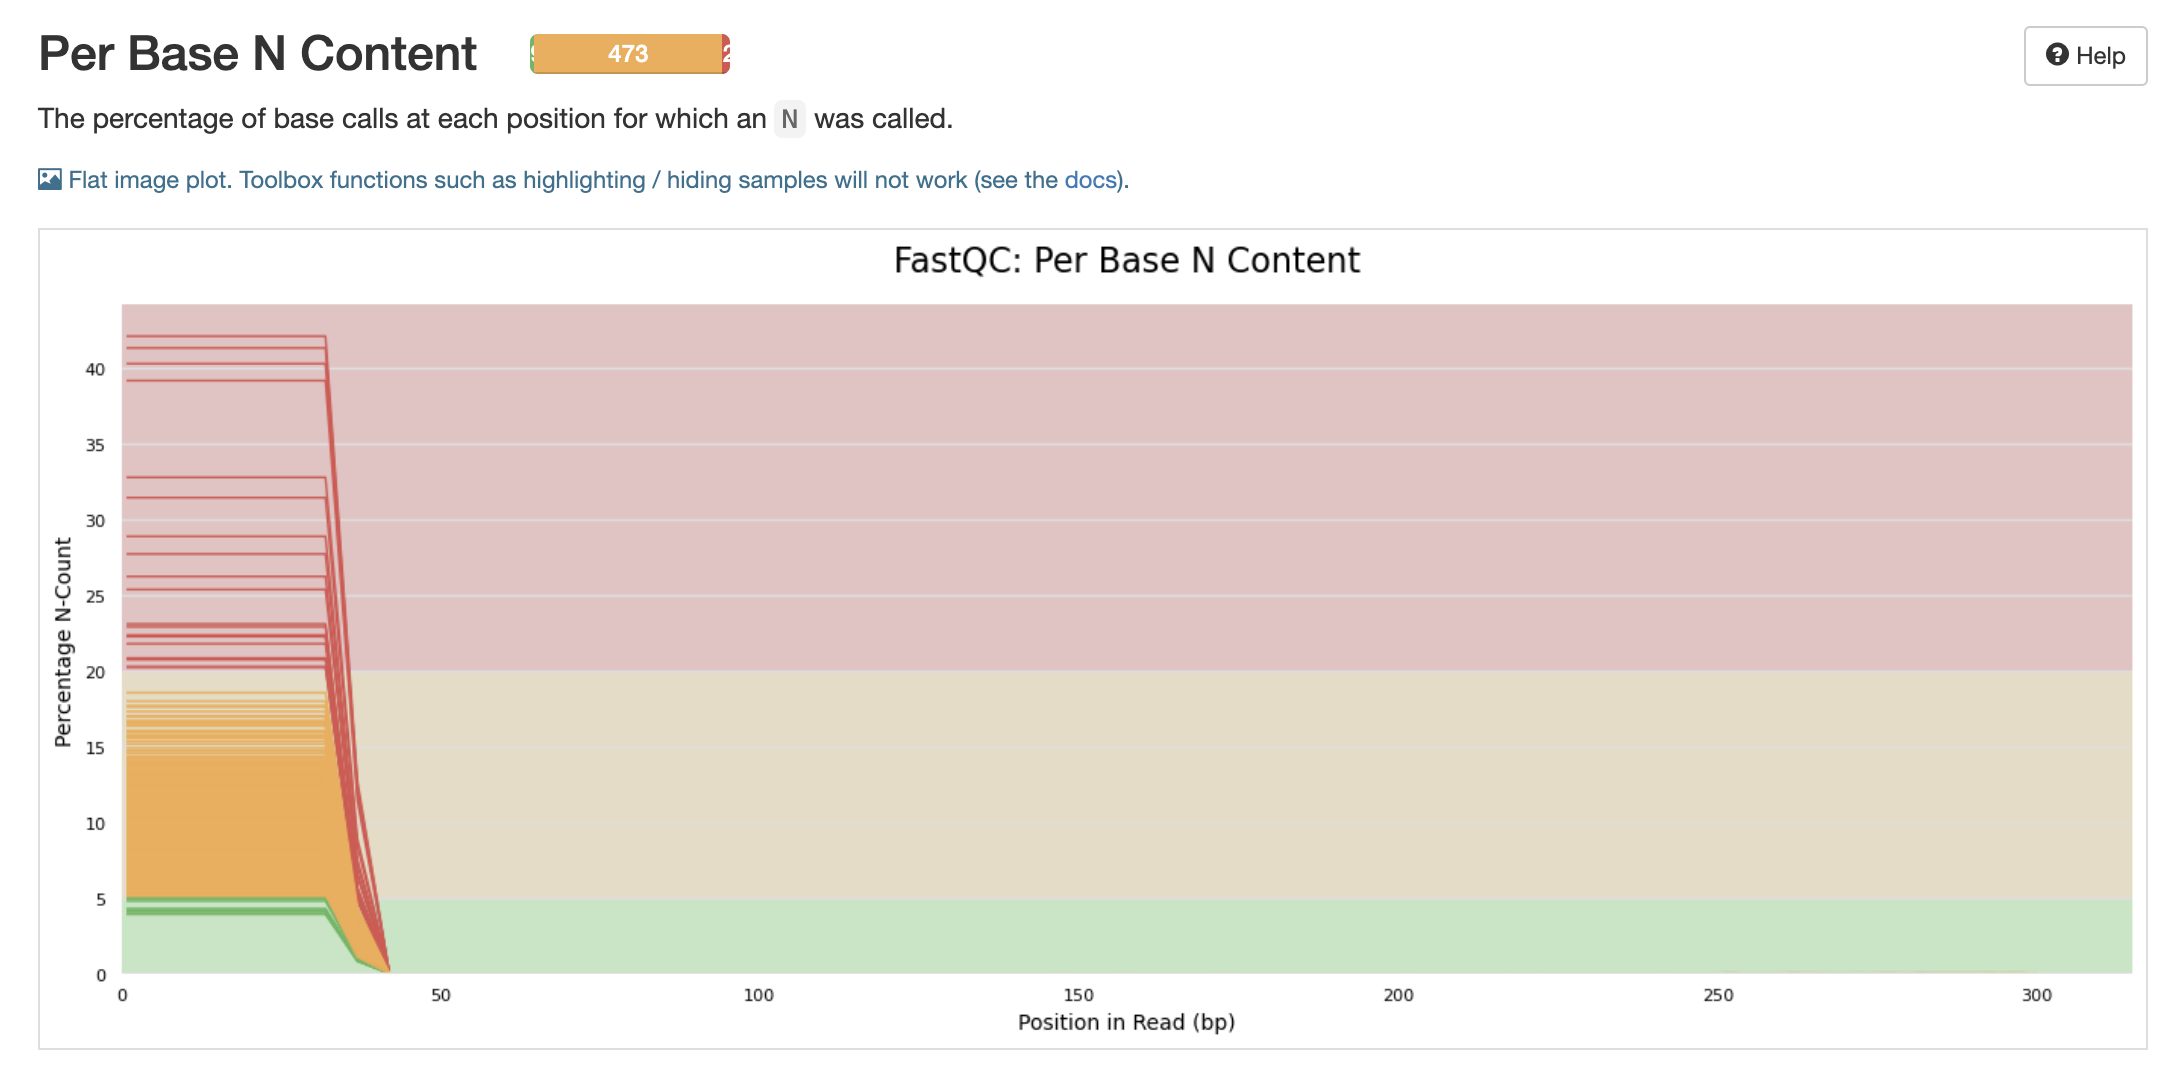 Will these N’s be filtered out with the adapter and primer cut outs?
I ran several scripts with different parameters and compared their denoising statistics to decide the final parameters.
Script Name: qiime2_RED_long_primer.sh:
--p-trunc-lenchoice: 215 reverse and 240 forward. This was based on the quality scores of the reads.--p-trim-leftchoice: 52 reverse and 54 forward. This was based on the primer lengths: 515F = 52 bp long; 806RB = 54 bp long. This include adapter overhang. See sequencing protocol to see primer choice.
Script Name: qiime2_RED_short_primer.sh:
--p-trunc-lenchoice: 215 reverse and 240 forward.--p-trim-leftchoice: 20 reverse and 19 forward (primers without adapters).
Script Name: qiime2_YELLOW_long_primer.sh:
--p-trunc-lenchoice: 180 for both forward and reverse.--p-trim-leftchoice: 52 reverse and 54 forward.
Script Name: qiime2_YELLOW_short_primer.sh:
--p-trunc-lenchoice: 180 for both forward and reverse.--p-trim-leftchoice: 20 reverse and 19 forward.
Script Name: qiime2_GREEN_long_primer.sh:
--p-trunc-lenchoice: 150 for both forward and reverse.--p-trim-leftchoice: 52 reverse and 54 forward.
Script Name: qiime2_GREEN_short_primer.sh:
--p-trunc-lenchoice: 150 for both forward and reverse.--p-trim-leftchoice: 20 reverse and 19 forward.
Denoising stats from the above scripts

I chose the ‘yellow-short’ choices because this resulted in just as high quality at the green parameter choices and is longer than the green parameter choices. 20 and 19 values will cut out the primer we used. The adapter are taken off by Janet and URI GSC.
Clustering post-DADA2 denoise steps
Description from QIIME2 documentation:
- We dereplicate our sequences to reduce repetition and file size/memory requirements in downstream steps (don’t worry! we keep count of each replicate).
- We cluster sequences to collapse similar sequences (e.g., those that are ≥ 97% similar to each other) into single replicate sequences. This process, also known as OTU picking, was once a common procedure, used to simultaneously dereplicate but also perform a sort of quick-and-dirty denoising procedure (to capture stochastic sequencing and PCR errors, which should be rare and similar to more abundant centroid sequences). Use denoising methods instead if you can. Times have changed. Welcome to the future.

Feature table description from QIIME2 documentation:
- The final products of all denoising and clustering methods/workflows are a FeatureTable[Frequency] (feature table) artifact and a FeatureData[Sequence] (representative sequences) artifact.
- The central record of all observations per sample.
- This output is required for all following steps.
denoise.sh
#!/bin/bash
#SBATCH -t 24:00:00
#SBATCH --nodes=1 --ntasks-per-node=1
#SBATCH --export=NONE
#SBATCH --mem=100GB
#SBATCH --mail-type=BEGIN,END,FAIL #email you when job starts, stops and/or fails
#SBATCH --mail-user=emma_strand@uri.edu #your email to send notifications
#SBATCH --account=putnamlab
#SBTACH -q putnamlab
#SBATCH -D /data/putnamlab/estrand/HoloInt_16s
#SBATCH --error="script_error_denoise" #if your job fails, the error report will be put in this file
#SBATCH --output="output_script_denoise" #once your job is completed, any final job report comments will be put in this file

source /usr/share/Modules/init/sh # load the module function
module load QIIME2/2021.4

#### METADATA FILES ####
# File path -- change this to correspond to what script you are running
cd /data/putnamlab/estrand/HoloInt_16s/

# Metadata path
METADATA="metadata/HoloInt_Metadata.txt"

# Sample manifest path
MANIFEST="metadata/HoloInt_sample-manifest-ES.csv"

#########################

#### DENOISING WITH DADA2

qiime dada2 denoise-paired --verbose --i-demultiplexed-seqs HoloInt_16S-paired-end-sequences.qza \
  --p-trunc-len-r 180 --p-trunc-len-f 180 \
  --p-trim-left-r 20 --p-trim-left-f 19 \
  --o-table table.qza \
  --o-representative-sequences rep-seqs.qza \
  --o-denoising-stats denoising-stats.qza \
  --p-n-threads 20

#### CLUSTERING

# Summarize feature table and sequences
qiime metadata tabulate \
  --m-input-file denoising-stats.qza \
  --o-visualization denoising-stats.qzv
qiime feature-table summarize \
  --i-table table.qza \
  --o-visualization table.qzv \
  --m-sample-metadata-file $METADATA
qiime feature-table tabulate-seqs \
  --i-data rep-seqs.qza \
  --o-visualization rep-seqs.qzv
Output files denoising-stats.qzv and table.qzv can be viewed in QIIME2 view.
From output_script_denoise:
R version 4.0.3 (2020-10-10)
DADA2: 1.18.0 / Rcpp: 1.0.6 / RcppParallel: 5.1.2
1) Filtering ...........................................................................................................................................................................................................................................................
2) Learning Error Rates
163714943 total bases in 1016863 reads from 38 samples will be used for learning the error rates.
162698080 total bases in 1016863 reads from 38 samples will be used for learning the error rates.
3) Denoise samples ...........................................................................................................................................................................................................................................................
...........................................................................................................................................................................................................................................................
4) Remove chimeras (method = consensus)
6) Write output
Running external command line application(s). This may print messages to stdout and/or stderr.
The command(s) being run are below. These commands cannot be manually re-run as they will depend on temporary files that no longer exist.

Command: run_dada_paired.R /tmp/tmp46pexmw7/forward /tmp/tmp46pexmw7/reverse /tmp/tmp46pexmw7/output.tsv.biom /tmp/tmp46pexmw7/track.tsv /tmp/tmp46pexmw7/filt_f /tmp/tmp46pexmw7/filt_r 180 180 19 20 2.0 2.0 2 12 independent consensus 1.0 20 1000000

Saved FeatureTable[Frequency] to: table.qza
Saved FeatureData[Sequence] to: rep-seqs.qza
Saved SampleData[DADA2Stats] to: denoising-stats.qza
Saved Visualization to: denoising-stats.qzv
Saved Visualization to: table.qzv
Saved Visualization to: rep-seqs.qzv
Copy output to desktop for qiime2 view
Outside of andromeda.
scp -r emma_strand@bluewaves.uri.edu:/data/putnamlab/estrand/HoloInt_16s/denoising-stats.qzv /Users/emmastrand/MyProjects/Acclim_Dynamics/16S_seq/QIIME2_20220228/denoising-stats.qzv
Switch to R.md script. Plots of the denoised statistics from the qzv file from above.


Average ~68% of reads kept per sample post denoise step.
Input # of seqs: 10,235,020
Non-chimeric # of seqs: 7,012,797
Taxonomy classification based on imported database
Description from QIIME2 documentation:
- We can do this by comparing our query sequences (i.e., our features, be they ASVs or OTUs) to a reference database of sequences with known taxonomic composition.
- Simply finding the closest alignment is not really good enough — because other sequences that are equally close matches or nearly as close may have different taxonomic annotations.
- So we use taxonomy classifiers to determine the closest taxonomic affiliation with some degree of confidence or consensus (which may not be a species name if one cannot be predicted with certainty!), based on alignment, k-mer frequencies, etc. More info on this here.
Workflow from QIIME2 documentation:

Reference database = FeatureData[Taxonomy] and FeatureData[Sequence].
Pre-trained classifier choice information here.
We chose the Silva 138 99% OTUs from 515F/806R region of sequences (MD5: e05afad0fe87542704be96ff483824d4) as the classifier because we used 515F and 806RB primers for our sequences and QIIME2 recommends the classify-sklearn classifier trainer.
Download classifier from QIIME2 documentation
wget https://data.qiime2.org/2021.4/common/silva-138-99-515-806-nb-classifier.qza
We also want to filter out unassigned and groups that include chloroplast and eukaryotic sequences.
Constructing phylogenetic trees
This aligns the sequences to assess the phylogenetic relationship between each of our features. Figure from QIIME2 documentation:

Part 1: alignment and masking (filtering out) positions that are highly variable and will add noise to the tree.
Part 2: phylogenetic tree construction.
taxonomy.sh
#!/bin/bash
#SBATCH -t 24:00:00
#SBATCH --nodes=1 --ntasks-per-node=1
#SBATCH --export=NONE
#SBATCH --mem=100GB
#SBATCH --mail-type=BEGIN,END,FAIL #email you when job starts, stops and/or fails
#SBATCH --mail-user=emma_strand@uri.edu #your email to send notifications
#SBATCH --account=putnamlab
#SBTACH -q putnamlab
#SBATCH -D /data/putnamlab/estrand/HoloInt_16s
#SBATCH --error="script_error_taxonomy" #if your job fails, the error report will be put in this file
#SBATCH --output="output_script_taxonomy" #once your job is completed, any final job report comments will be put in this file

source /usr/share/Modules/init/sh # load the module function
module load QIIME2/2021.4

#### METADATA FILES ####
# File path -- change this to correspond to what script you are running
cd /data/putnamlab/estrand/HoloInt_16s/

# Metadata path
METADATA="metadata/HoloInt_Metadata.txt"

# Sample manifest path
MANIFEST="metadata/HoloInt_sample-manifest-ES.csv"

#########################

#### TAXONOMY CLASSIFICATION

qiime feature-classifier classify-sklearn \
  --i-classifier metadata/silva-138-99-515-806-nb-classifier.qza \
  --i-reads rep-seqs.qza \
  --o-classification taxonomy.qza

qiime taxa filter-table \
     --i-table table.qza \
     --i-taxonomy taxonomy.qza \
     --p-mode contains \
     --p-exclude "Unassigned","Chloroplast","Eukaryota" \
     --o-filtered-table table-filtered.qza

qiime metadata tabulate \
    --m-input-file taxonomy.qza \
    --o-visualization taxonomy.qzv
qiime taxa barplot \
    --i-table table-filtered.qza \
    --i-taxonomy taxonomy.qza \
    --m-metadata-file $METADATA \
    --o-visualization taxa-bar-plots-filtered.qzv
qiime metadata tabulate \
    --m-input-file rep-seqs.qza \
    --m-input-file taxonomy.qza \
    --o-visualization tabulated-feature-metadata.qzv

qiime feature-table summarize \
    --i-table table-filtered.qza \
    --o-visualization table-filtered.qzv \
    --m-sample-metadata-file $METADATA

#### CREATES PHYLOGENETIC TREES

# align and mask sequences
qiime alignment mafft \
  --i-sequences rep-seqs.qza \
  --o-alignment aligned-rep-seqs.qza
qiime alignment mask \
  --i-alignment aligned-rep-seqs.qza \
  --o-masked-alignment masked-aligned-rep-seqs.qza

# calculate tree
qiime phylogeny fasttree \
  --i-alignment masked-aligned-rep-seqs.qza \
  --o-tree unrooted-tree.qza
qiime phylogeny midpoint-root \
  --i-tree unrooted-tree.qza \
  --o-rooted-tree rooted-tree.qza
From output_script_taxonomy:
Saved FeatureData[Taxonomy] to: taxonomy.qza
Saved FeatureTable[Frequency] to: table-filtered.qza
Saved Visualization to: taxonomy.qzv
Saved Visualization to: taxa-bar-plots-filtered.qzv
Saved Visualization to: tabulated-feature-metadata.qzv
Saved FeatureData[AlignedSequence] to: aligned-rep-seqs.qza
Saved FeatureData[AlignedSequence] to: masked-aligned-rep-seqs.qza
Saved Phylogeny[Unrooted] to: unrooted-tree.qza
Saved Phylogeny[Rooted] to: rooted-tree.qza
From script_error_taxonomy:
No contents (no errors found).
Copy output to desktop for qiime2 view
Outside of andromeda.
scp -r emma_strand@bluewaves.uri.edu:/data/putnamlab/estrand/HoloInt_16s/taxa-bar-plots-filtered.qzv /Users/emmastrand/MyProjects/Acclim_Dynamics/16S_seq/QIIME2_20220228/taxa-bar-plots-filtered.qzv

scp -r emma_strand@bluewaves.uri.edu:/data/putnamlab/estrand/HoloInt_16s/table-filtered.qza /Users/emmastrand/MyProjects/Acclim_Dynamics/16S_seq/QIIME2_20220228/table-filtered.qza

scp -r emma_strand@bluewaves.uri.edu:/data/putnamlab/estrand/HoloInt_16s/tabulated-feature-metadata.qzv /Users/emmastrand/MyProjects/Acclim_Dynamics/16S_seq/QIIME2_20220228/tabulated-feature-metadata.qzv

scp -r emma_strand@bluewaves.uri.edu:/data/putnamlab/estrand/HoloInt_16s/table.qzv /Users/emmastrand/MyProjects/Acclim_Dynamics/16S_seq/QIIME2_20220228/table.qzv
Results pre-filtering for “Unassigned”,”Chloroplast”,”Eukaryota”

7,012,797 reads that passed denoise.sh. Average is little under 30k reads per sample.

Results post-filtering for “Unassigned”,”Chloroplast”,”Eukaryota”
Summarize filtered feature table. I ran this in interactive mode after running taxonomy.sh. Include this in the taxonomy script prior to running again.
$ interactive
$ source /usr/share/Modules/init/sh
$ module load QIIME2/2021.4

$ qiime feature-table summarize \
       --i-table table-filtered.qza \
       --o-visualization table-filtered.qzv \
       --m-sample-metadata-file metadata/HoloInt_Metadata.txt

### outside of andromeda
scp -r emma_strand@bluewaves.uri.edu:/data/putnamlab/estrand/HoloInt_16s/table-filtered.qzv /Users/emmastrand/MyProjects/Acclim_Dynamics/16S_seq/QIIME2_20220228/table-filtered.qzv

3,267,918 reads that passed filtering step in taxonomy.sh. 13,019 average reads per sample leftover to analyze.

63 samples under 1,000 reads. All of these are P.acuta except for 1. They are scattered across timepoints and treatments. But removing a sample drops our sample size down to n=2 since we are starting at n=3. Think about testing temperature only instead? pCO2 as a random effect like tank?
81 samples under 1,500 reads. 2/81 of these samples are M. capitata. Also scattered across time and treatment.
Subsampling and diversity indices
The various diversity analyses you can do with QIIME2:

--p-sampling-depth 110 \ only removes 2 samples for now.
--p-max-depth 40000 \. The range of samples is high so I’m starting with 40,000 to see where our rarefraction curve stabilizes.
To re-run this script, need to delete core-metrics-results folder or rename the original folder.
diversity.sh
#!/bin/bash
#SBATCH -t 24:00:00
#SBATCH --nodes=1 --ntasks-per-node=1
#SBATCH --export=NONE
#SBATCH --mem=100GB
#SBATCH --mail-type=BEGIN,END,FAIL #email you when job starts, stops and/or fails
#SBATCH --mail-user=emma_strand@uri.edu #your email to send notifications
#SBATCH --account=putnamlab
#SBTACH -q putnamlab
#SBATCH -D /data/putnamlab/estrand/HoloInt_16s
#SBATCH --error="script_error_diversity" #if your job fails, the error report will be put in this file
#SBATCH --output="output_script_diversity" #once your job is completed, any final job report comments will be put in this file

source /usr/share/Modules/init/sh # load the module function
module load QIIME2/2021.4

#### METADATA FILES ####
# File path -- change this to correspond to what script you are running
cd /data/putnamlab/estrand/HoloInt_16s/

# Metadata path
METADATA="metadata/HoloInt_Metadata.txt"

# Sample manifest path
MANIFEST="metadata/HoloInt_sample-manifest-ES.csv"

#########################

#### CALCULATES OVERALL DIVERSITY
## change sub sampling depth values

qiime diversity core-metrics-phylogenetic \
  --i-phylogeny rooted-tree.qza \
  --i-table table-filtered.qza \
  --p-sampling-depth 110 \
  --m-metadata-file $METADATA \
  --output-dir core-metrics-results

qiime diversity alpha-group-significance \
  --i-alpha-diversity core-metrics-results/faith_pd_vector.qza \
  --m-metadata-file $METADATA \
  --o-visualization core-metrics-results/faith-pd-group-significance.qzv
qiime diversity alpha-group-significance \
  --i-alpha-diversity core-metrics-results/evenness_vector.qza \
  --m-metadata-file $METADATA \
  --o-visualization core-metrics-results/evenness-group-significance.qzv

qiime diversity beta-group-significance \
  --i-distance-matrix core-metrics-results/unweighted_unifrac_distance_matrix.qza \
  --m-metadata-file $METADATA \
  --m-metadata-column Timepoint \
  --o-visualization core-metrics-results/unweighted-unifrac-station-significance.qzv \
  --p-pairwise
qiime diversity beta-group-significance \
  --i-distance-matrix core-metrics-results/unweighted_unifrac_distance_matrix.qza \
  --m-metadata-file $METADATA  \
  --m-metadata-column Treatment \
  --o-visualization core-metrics-results/unweighted-unifrac-group-significance.qzv \
  --p-pairwise

# This script calculates the rarefaction curve for the data
  qiime diversity alpha-rarefaction \
    --i-table table-filtered.qza \
    --i-phylogeny rooted-tree.qza \
    --p-max-depth 40000 \
    --m-metadata-file $METADATA \
    --o-visualization alpha-rarefaction.qzv
Calculating abundance measures: Analysis of compostion (ANCOM)
Determines differential abundance of taxa/OTUs based on designated metadata variable (categorical) from mapping file
- Assumes that less than 25% of the taxa determined in the samples are differentially abundant.
- If you suspect that more than 25% of your taxa are differentially abundant then you should not use this test because it will likely give you false results and increase the chance of type I and type II error.
Resulting script section for ANCOM – put in at end if want to
Come back to adding this in unless metadata has 1 column with trt and timepoint? This might just be easier in R.
qiime composition add-pseudocount \
    --i-table table.qza \
    --o-composition-table comp-table.qza

qiime composition ancom \
    --i-table comp-table.qza \
    --m-metadata-file $METADATA \
    --m-metadata-column
    --o-visualization
From script_error_diversity:
No contents (no errors found).
From output_script_diversity:
Saved FeatureTable[Frequency] to: core-metrics-results/rarefied_table.qza
Saved SampleData[AlphaDiversity] to: core-metrics-results/faith_pd_vector.qza
Saved SampleData[AlphaDiversity] to: core-metrics-results/observed_features_vector.qza
Saved SampleData[AlphaDiversity] to: core-metrics-results/shannon_vector.qza
Saved SampleData[AlphaDiversity] to: core-metrics-results/evenness_vector.qza
Saved DistanceMatrix to: core-metrics-results/unweighted_unifrac_distance_matrix.qza
Saved DistanceMatrix to: core-metrics-results/weighted_unifrac_distance_matrix.qza
Saved DistanceMatrix to: core-metrics-results/jaccard_distance_matrix.qza
Saved DistanceMatrix to: core-metrics-results/bray_curtis_distance_matrix.qza
Saved PCoAResults to: core-metrics-results/unweighted_unifrac_pcoa_results.qza
Saved PCoAResults to: core-metrics-results/weighted_unifrac_pcoa_results.qza
Saved PCoAResults to: core-metrics-results/jaccard_pcoa_results.qza
Saved PCoAResults to: core-metrics-results/bray_curtis_pcoa_results.qza
Saved Visualization to: core-metrics-results/unweighted_unifrac_emperor.qzv
Saved Visualization to: core-metrics-results/weighted_unifrac_emperor.qzv
Saved Visualization to: core-metrics-results/jaccard_emperor.qzv
Saved Visualization to: core-metrics-results/bray_curtis_emperor.qzv
Saved Visualization to: core-metrics-results/faith-pd-group-significance.qzv
Saved Visualization to: core-metrics-results/evenness-group-significance.qzv
Saved Visualization to: core-metrics-results/unweighted-unifrac-station-significance.qzv
Saved Visualization to: core-metrics-results/unweighted-unifrac-group-significance.qzv
Saved Visualization to: alpha-rarefaction.qzv
Copy core-metrics folder outside of andromeda.
### outside of andromeda
scp -r emma_strand@bluewaves.uri.edu:/data/putnamlab/estrand/HoloInt_16s/alpha-rarefaction.qzv /Users/emmastrand/MyProjects/Acclim_Dynamics/16S_seq/QIIME2_20220228/alpha-rarefaction.qzv

scp -r emma_strand@bluewaves.uri.edu:/data/putnamlab/estrand/HoloInt_16s/core-metrics-results /Users/emmastrand/MyProjects/Acclim_Dynamics/16S_seq/QIIME2_20220228/core-metrics-results
Run rarefraction curve again with a different sampling depth cut-off
$ nano rarefraction.sh

#!/bin/bash
#SBATCH -t 24:00:00
#SBATCH --nodes=1 --ntasks-per-node=1
#SBATCH --export=NONE
#SBATCH --mem=100GB
#SBATCH --mail-type=BEGIN,END,FAIL #email you when job starts, stops and/or fails
#SBATCH --mail-user=emma_strand@uri.edu #your email to send notifications
#SBATCH --account=putnamlab
#SBTACH -q putnamlab
#SBATCH -D /data/putnamlab/estrand/HoloInt_16s
#SBATCH --error="script_error_rarefraction" #if your job fails, the error report will be put in this file
#SBATCH --output="output_script_rarefraction" #once your job is completed, any final job report comments will be put in this file

source /usr/share/Modules/init/sh # load the module function
module load QIIME2/2021.4

#### METADATA FILES ####
# File path -- change this to correspond to what script you are running
cd /data/putnamlab/estrand/HoloInt_16s/

# Metadata path
METADATA="metadata/HoloInt_Metadata.txt"

# Sample manifest path
MANIFEST="metadata/HoloInt_sample-manifest-ES.csv"

#########################

qiime diversity alpha-rarefaction \
    --i-table table-filtered.qza \
    --i-phylogeny rooted-tree.qza \
    --p-max-depth 20000 \
    --m-metadata-file $METADATA \
    --o-visualization alpha-rarefaction-20000.qzv
scp -r emma_strand@bluewaves.uri.edu:/data/putnamlab/estrand/HoloInt_16s/alpha-rarefaction-20000.qzv /Users/emmastrand/MyProjects/Acclim_Dynamics/16S_seq/QIIME2_20220228/alpha-rarefaction-20000.qzv
Sampling depth of 40,000 to capture all samples.

Sampling depth of 20,000 to view the above figure more easily.

To capture all of the diversity, it looks like we need a sampling depth of closer to 4k.
Switch to R to visualize the feature tables
See QIIME2 documentation for suggestions on how to visualize data.

In QIIME2 View webpage, you can insert the output .qza or .qzv files from QIIME2 program and then download a CSV based on what subset of the .qza/v file you want.
To get a .csv file with abundance counts of each taxa group by sample ID, upload the taxa-bar-plots.qzv file to qiime2 view. Select the level of classification you want and then select the ‘csv’ button to the top left of the screen.
copy and paste the core-metrics-results folder or specific desired files
$ scp -r emma_strand@bluewaves.uri.edu:/data/putnamlab/estrand/HoloInt_16s/core-metrics-results /Users/emmastrand/MyProjects/Acclim_Dynamics/16S_seq/ES-run

$ scp -r emma_strand@bluewaves.uri.edu:/data/putnamlab/estrand/HoloInt_16s/yellow-long-primer-filtered/taxa-bar-plots.qzv /Users/emmastrand/MyProjects/Acclim_Dynamics/16S_seq/ES-run/yellow-long-primer-filtered-taxa-bar-plots.qzv
UNUSED SCRIPT (NOTES) AND TROUBLESHOOTING
Filtering by taxon and identifying those sequences in d__Bacteria
We chose to filter out the unassigned, eukaryotic, and chloroplast sequences from our dataset. I then downloaded the tsv file from the taxonomy.qzv to get: feature-id and taxon ID. As well as the rep-seqs.qzv file to get the feature-id and actual sequence.
scp -r emma_strand@bluewaves.uri.edu:/data/putnamlab/estrand/HoloInt_16s/yellow-long-primer/taxonomy.qzv /Users/emmastrand/MyProjects/Acclim_Dynamics/16S_seq/ES-run/yellow-long-taxonomy.qzv

scp -r emma_strand@bluewaves.uri.edu:/data/putnamlab/estrand/HoloInt_16s/yellow-long-primer/rep-seqs.qzv /Users/emmastrand/MyProjects/Acclim_Dynamics/16S_seq/ES-run/yellow-long-rep-seqs.qzv
scp -r emma_strand@bluewaves.uri.edu:/data/putnamlab/estrand/HoloInt_16s/yellow-short-primer/taxonomy.qzv /Users/emmastrand/MyProjects/Acclim_Dynamics/16S_seq/ES-run/yellow-short-taxonomy.qzv

scp -r emma_strand@bluewaves.uri.edu:/data/putnamlab/estrand/HoloInt_16s/yellow-short-primer/rep-seqs.qzv /Users/emmastrand/MyProjects/Acclim_Dynamics/16S_seq/ES-run/yellow-short-rep-seqs.qzv
- In QIIME2 view, upload the yellow-long-taxonomy.qzv file, and order the taxon column alphabetically to all of the d__Bacteria next to each other.
- Open a new window for another qiime2 view page, and upload the yellow-long-rep-seqs.qzv file.
- Cross reference the feature ID to get the sequence. The sequence will have a hyperlink to the NCBI blast search for that ID.
- Click the hyperlink and the ‘View Report’ button to search.
I made the following script with Erin Chille’s to subset rep sequences to the feature IDs associated with the generic ‘d__Bacteria’ and then BLAST those results.
#!/bin/bash
#SBATCH -t 24:00:00
#SBATCH --nodes=1 --ntasks-per-node=1
#SBATCH --export=NONE
#SBATCH --mem=100GB
#SBATCH --mail-type=BEGIN,END,FAIL #email you when job starts, stops and/or fails
#SBATCH --mail-user=emma_strand@uri.edu #your email to send notifications
#SBATCH --account=putnamlab
#SBATCH -D /data/putnamlab/estrand/HoloInt_16s/
#SBATCH --error="script_error" #if your job fails, the error report will be put in this file
#SBATCH --output="output_script" #once your job is completed, any final job report comments will be put in this file

source /usr/share/Modules/init/sh # load the module function
module load all/BLAST+/2.10.1-gompi-2020a

# File path -- change this to correspond to what script you are running
cd /data/putnamlab/estrand/HoloInt_16s

# Indexing the fasta file

makeblastdb -in yellow-short.fasta  -input_type fasta -dbtype nucl -parse_seqids -out yellow-short-dbact-indexed

# Using blastbcmd to createfrom the fasta file

while read -r FeatureID Taxon Confidence; do
        echo "$FeatureID"; blastdbcmd -entry "$FeatureID" -db yellow-short-dbact-indexed  -outfmt "%f" >> blast-dbact-sequences.fasta;
done < yellow-short-metadata-dBact.tsv

# Blast the dbact sequences
# Script below written by Erin Chille

# Runs blastp against the remote nr database
blastn -query blast-dbact-sequences.fasta -db nr -remote -evalue 1e-05 -max_hsps 1 -culling_limit 1 -out ALIGNMENT_REPORT_DBACT.out

# You can customize your blast algorithm search here. For mine I only wanted the top hit for each sequence so culling limit and max hsp are set to 2

RID=($(grep RID ALIGNMENT_REPORT_DBACT.out | head -1 | sed -e 's/RID: //g'))

# Extract the RID number. This is your remote identification number and Blast stores all of your output here. Here, I'm extacting it so I can use it to customize my results with the bla$

# Customize your results using your RID number as input

blast_formatter -rid "$RID" \
        -outfmt "10 qseqid sacc sscinames stitle pident length mismatch gapopen qstart qend sstart send evalue bitscore" \
        -out dbact.sequences.report.csv
OTU vs. ASV and program choices
Nicola did:
1.) Retain only PE reads that match amplicon primer.
2.) Remove reads containing Illumina sequencing adapters.
3.) Cut out first 4 ‘de-generate’ basepairs.
4.) Cut out reads that don’t start with the 16s primer
5.) Removes primer
6.) DADA2 pipeline
Seems like there a couple programs to use choose from..
Apparently DADA2 is a newer version for bacteria (good to use if that’s what you’re working on) and Qiime2 is established/tried & true methods. Qiime2 might be safer option?
DADA2 produces an amplicon sequence variant (ASV) table which is a higher resolution analogue of the traditional OTU table and records the number of times each exact amplicon sequence variant was observed in each sample.
Qiime2 produces OTUs (“tried and true”)
OTU vs. ASV information here.
There was no checksum file from URI GSC but I created one once Hollie transfered them to my folder on andromeda to reference back to if needed.
Create a new checksum file (md5sum)
# Create file (takes ~6-7 min to complete)
$ md5sum *.fastq.gz > 16s-checksum2.md5

# Read the created file above
$ nano 16s-checksum2.md5

Output (first six lines):
210b589620ef946cd5c51023b0f90d8d  HPW060_S44_L001_R1_001.fastq.gz
227032c7b7f7fa8c407cb0509a1fcd6a  HPW060_S44_L001_R2_001.fastq.gz
2f8d8892b7be06cf047a1085dd8bbbf1  HPW061_S56_L001_R1_001.fastq.gz
b603f7ff519130555527bec4c8f8e2c6  HPW061_S56_L001_R2_001.fastq.gz
32c549eb8422ac2ba7affe3dedfb4d3b  HPW062_S68_L001_R1_001.fastq.gz
4caef9d9f684e8345060fdc5896159c8  HPW062_S68_L001_R2_001.fastq.gz

# Check that the individual files went into the new md5 file OK
$ md5sum -c 16s-checksum2.md5

Output: all files = OK
CUTADAPT
We trimmed based on primer length within the Qiime2 program.
User guide for cutadapt here. Basic function:
cutadapt -g F_PRIMER -G R_PRIMER --untrimmed-output file --untrimmed-paired-output file -o R1 file -p R2 file input1 input2 .
Flags in the command:
-g: corresponds to the adapter type. We used regular 5’ adapters which calls for-g.-Gcorresponds to R2 read.-q (or --quality-cutoff): Illumina reads are high quality at the beginning and degrade towards the 3’ end. cutadapt uses 10 as their example.--untrimmed-output: Write all reads without adapters to FILE (in FASTA/FASTQ format) instead of writing them to the regular output file.--untrimmed-paired-output: Used together with –untrimmed-output. The second read in a pair is written to this file when the processed pair was not trimmed.-
-p: for paired end; R2 file
Primer sequences with the URI GSC adapter overhang:
- 515 Forward: TCGTCGGCAGCGTCAGATGTGTATAAGAGACAGGTGCCAGCMGCCGCGGTAA
- 806 Reverse (RB): GTCTCGTGGGCTCGGAGATGTGTATAAGAGACAGGGACTACNVGGGTWTCTAAT
Make a directory for processed data
$ mkdir processed_data
Make a script to run cut adapt program
I took out the mail notification for the beginning of the slurm script to reduce the number of emails. Include the source message for the script to recognize bash and zsh functions.
#!/bin/bash
#SBATCH -t 24:00:00
#SBATCH --nodes=1 --ntasks-per-node=1
#SBATCH --export=NONE
#SBATCH --mem=100GB
#SBATCH --mail-type=END,FAIL #email you when job starts, stops and/or fails
#SBATCH --mail-user=emma_strand@uri.edu #your email to send notifications
#SBATCH --account=putnamlab
#SBATCH -D /data/putnamlab/estrand/HoloInt_16s/raw-data
#SBATCH --error="script_error" #if your job fails, the error report will be put in this file
#SBATCH --output="output_script" #once your job is completed, any final job report comments will be put in this file

source /usr/share/Modules/init/sh # this is used so that them function can be found in zsh and bash

# Trims the forward and reverse primers from the forward and reverse read file respectively in paired-end sequences

for file in /data/putnamlab/estrand/HoloInt_16s/raw-data/*fastq.gz
do
cutadapt -g F -G R
done

# Trims the reverse complement of the reverse primer and reverse complement of the forward primer from the forward and reverse read file respectively in paired-end sequences

for file in /data/putnamlab/estrand/HoloInt_16s/raw-data/*fastq.gz
do

done
Creating a script to load the downloaded programs
Make a directory for that script
$ mkdir scripts
$ cd scripts
Create the file and input the commands you need.
$ nano module-load.sh #creates the file

#!/bin/bash
#SBATCH -t 24:00:00
#SBATCH --nodes=1 --ntasks-per-node=1
#SBATCH --export=NONE
#SBATCH --mem=100GB
#SBATCH --mail-type=BEGIN,END,FAIL #email you when job starts, stops and/or fails
#SBATCH --mail-user=emma_strand@uri.edu #your email to send notifications
#SBATCH --account=putnamlab
#SBATCH -D /data/putnamlab/estrand/HoloInt_16s/
#SBATCH --error="script_error" #if your job fails, the error report will be put in this file
#SBATCH --output="output_script" #once your job is completed, any final job report comments will be put in this file

source /usr/share/Modules/init/sh # this is used so that them function can be found in zsh and bash

module load Miniconda3/4.9.2
module load FastQC/0.11.9-Java-11
module load MultiQC/1.9-intel-2020a-Python-3.8.2
module load cutadapt/2.10-GCCcore-9.3.0-Python-3.8.2
module load QIIME2/2021.4
Run the script:
$ sbatch module-load.sh
Viewing raw data using qiime2 instead of multiqc
To assess quality of the reads, either view in the multiqc report generated from above or QIIME2 view webpage. QIIME2 view allows you to look at forward and reverse reads separately.
- I made a short version of the qiime2 script that just included the qiime2 import section and metadata so that I could past the
processed_data/HoloInt_16S-paired-end-sequences1.qzafile into QIIME2 view webpage. - Then used this code outside of andromeda to secure copy paste the file to my github repo:
scp emma_strand@bluewaves.uri.edu:/data/putnamlab/estrand/HoloInt_16s/processed_data/HoloInt_16S-paired-end-sequences1.qza /Users/emmastrand/MyProjects/Acclim_Dynamics/16S_seq/ES-run. This is a big file and took five minutes to download. - This .qza file was too big to view on qiimeview.org so I tried
qiime tools peek HoloInt_16S-paired-end-sequences1.qzaonce I was in theprocessed_datafolder. This produced the below, but this isn’t what I was looking for.
UUID:        787d9582-6575-4d03-9c36-cfb5cedf99b7
Type:        SampleData[PairedEndSequencesWithQuality]
Data format: SingleLanePerSamplePairedEndFastqDirFmt
I fixed this by adding -ip to the multiqc report function. The default is a flat report that you aren’t able to filter or interact with when opening the html version of the multiqc report.
Filtering by taxonomic identity troubleshooting
Tried the below commands but table-filtered.qza is not outputting and therefore the taxa-bar-plots-filtered is also not outputting. Only output is tabulated-feature-metadata-filtered.qzv and taxonomy-filtered.qzv.
qiime taxa filter-table \
   --i-table table.qza \
   --i-taxonomy taxonomy.qza \
   --p-mode contain \
   --p-exclude "Unassigned", "Chloroplast", "Eukaryota" \
   --o-filtered-table ../filtered/table-filtered.qza

qiime metadata tabulate \
  --m-input-file taxonomy.qza \
  --o-visualization ../filtered/taxonomy-filtered.qzv
qiime taxa barplot \
  --i-table ../filtered/table-filtered.qza \
  --i-taxonomy taxonomy.qza \
  --m-metadata-file $METADATA \
  --o-visualization ../filtered/taxa-bar-plots-filtered.qzv
qiime metadata tabulate \
  --m-input-file rep-seqs.qza \
  --m-input-file taxonomy.qza \
  --o-visualization ../filtered/tabulated-feature-metadata-filtered.qzv
The code chunk above and the format --p-exclude "Unassigned","Chloroplast","Eukaryota" \ returned the error that the command is actually --p-mode contains not --p-mode contain.
The documentation for this command:
--p-exclude TEXT       One or more search terms that indicate which taxa
                       should be excluded from the resulting table. If
                       providing more than one term, terms should be
                       delimited by the query-delimiter character. By
                       default, no taxa will be excluded.         [optional]
--p-query-delimiter TEXT
                       The string used to delimit multiple search terms
                       provided to include or exclude. This parameter should
                       only need to be modified if the default delimiter (a
                       comma) is used in the provided taxonomic annotations.
                                                              [default: ',']
I then tried this iteration: --p-exclude Unassigned, Chloroplast, Eukaryota \ but got this error ` (1/1) Got unexpected extra arguments (Chloroplast, Eukaryota)`.
I realized the two files that were outputting don’t need to be labeled as filtered because they are not using the table-filtered file and just need to be --o-visualization ../filtered/taxonomy.qzv and --o-visualization ../filtered/tabulated-feature-metadata.qzv.
Final script that worked:
qiime taxa filter-table \
   --i-table table.qza \
   --i-taxonomy taxonomy.qza \
   --p-mode contains \
   --p-exclude "Unassigned","Chloroplast","Eukaryota" \
   --o-filtered-table ../filtered/table-filtered.qza

qiime metadata tabulate \
  --m-input-file taxonomy.qza \
  --o-visualization ../filtered/taxonomy.qzv
qiime taxa barplot \
  --i-table ../filtered/table-filtered.qza \
  --i-taxonomy taxonomy.qza \
  --m-metadata-file $METADATA \
  --o-visualization ../filtered/taxa-bar-plots-filtered.qzv
qiime metadata tabulate \
  --m-input-file rep-seqs.qza \
  --m-input-file taxonomy.qza \
  --o-visualization ../filtered/tabulated-feature-metadata.qzv
copy and paste the taxa-bar-plots-filtered.qzv file onto desktop.
scp -r emma_strand@bluewaves.uri.edu:/data/putnamlab/estrand/HoloInt_16s/filtered/taxa-bar-plots-filtered.qzv /Users/emmastrand/MyProjects/Acclim_Dynamics/16S_seq/ES-run/taxa-bar-plots-yellow-short-filtered.qzv

scp -r /Users/emmastrand/MyProjects/Acclim_Dynamics/16S_seq/ES-run/yellow-short-primer/yellow-short.fasta emma_strand@bluewaves.uri.edu:/data/putnamlab/estrand/HoloInt_16s/

scp -r emma_strand@bluewaves.uri.edu:/data/putnamlab/estrand/HoloInt_16s/blast-dbact-output.fasta /Users/emmastrand/MyProjects/Acclim_Dynamics/16S_seq/ES-run/blast-dbact-output.fasta

scp -r emma_strand@bluewaves.uri.edu:/data/putnamlab/estrand/HoloInt_16s/yellow-short-metadata-dBact.tsv /Users/emmastrand/MyProjects/Acclim_Dynamics/16S_seq/ES-run/yellow-short-metadata-dBact.tsv

scp -r /Users/emmastrand/MyProjects/Acclim_Dynamics/16S_seq/ES-run/yellow-short-metadata-dBact.tsv emma_strand@bluewaves.uri.edu:/data/putnamlab/estrand/HoloInt_16s/yellow-short-metadata-dBact.tsv

scp -r emma_strand@bluewaves.uri.edu:/data/putnamlab/estrand/HoloInt_16s/ALIGNMENT_REPORT_DBACT.out /Users/emmastrand/MyProjects/Acclim_Dynamics/16S_seq/ES-run/ALIGNMENT_REPORT_DBACT.out

scp -r emma_strand@bluewaves.uri.edu:/data/putnamlab/estrand/HoloInt_16s/dbact.sequences.report.csv /Users/emmastrand/MyProjects/Acclim_Dynamics/16S_seq/ES-run/dbact.sequences.report.csv